
988368
Thu, Jun 11, 2026

Volume 16, Issue 3 (September 2018)
Iranian Rehabilitation Journal 2018, 16(3): 307-316 |
Back to browse issues page


Download citation:
BibTeX | RIS | EndNote | Medlars | ProCite | Reference Manager | RefWorks
Send citation to:


BibTeX | RIS | EndNote | Medlars | ProCite | Reference Manager | RefWorks
Send citation to:
Yousefi R, Ghayour Mobarhan M, Esmaily H, Saki A, Ashley Anthony Ferns G, Tayefi M. Identifying Factors Associated With Hypertension Using Structural Equation Modeling: A Population-Based Study. Iranian Rehabilitation Journal 2018; 16 (3) :307-316
URL: http://irj.uswr.ac.ir/article-1-851-en.html
URL: http://irj.uswr.ac.ir/article-1-851-en.html
Razieh Yousefi1 

 , Majid Ghayour Mobarhan2 , Habibollah Esmaily3 , Azadeh Saki *3 , Gordon Ashley Anthony Ferns4 , Maryam Tayefi2
, Majid Ghayour Mobarhan2 , Habibollah Esmaily3 , Azadeh Saki *3 , Gordon Ashley Anthony Ferns4 , Maryam Tayefi2
1- Department of Biostatistics, School of Health, Mashhad University of Medical Sciences, Mashhad, Iran.
2- Endocrinology & Metabolism Research Center, School of Medicine, Mashhad University of Medical Sciences, Mashhad, Iran.
3- Research Center for Social Factors Affecting Health, Mashhad University of Medical Sciences, Mashhad, Iran.
4- Division of Medical Education, Brighton & Sussex Medical School, Brighton, England.
Keywords: Cardiovascular diseases, Hypertension, Blood pressure, Structural equation modeling, Latent variables
Full-Text [PDF 617 kb]
(2807 Downloads)
| Abstract (HTML) (6802 Views)


Full-Text: (1801 Views)
1. Introduction
Hypertension is a prevalent chronic disease and accordingly a global major health issue. Hypertension is an important risk factor for cardiovascular diseases and studies showed that even people with slightly high blood pressure have an increased risk for cardiovascular disease [1].
The prevalence of hypertension varies between different populations. According to the World Health Organization, the number of people with hypertension is estimated to be approximately one billion, and mortality rate associated with this disease is 1.7 million people per annum, globally [2, 3]. Approximately one of every 3 adults is affected with hypertension [4]. In Iran, the prevalence of hypertension is about 25% in the whole population and 32% in adults [5].
High blood pressure may lead to microvascular and macrovascular damages, and undoubtedly hypertension-associated diseases and events are risk factors for disability [6-9]. Disability happens if an organ fails to perform its function [7]. Millions of dollars are directly spent to treat these diseases and their disabilities. Therefore, identification of risk factors for designing preventive programs is very important.
Several studies investigated the risk factors associated with hypertension. The important known risk factors for high blood pressure include age, genetic factors, overweight/obesity, smoking, high cholesterol, diabetes mellitus, and physical inactivity [4, 10]. The prevalence of hypertension is approximately 50%, and there is a positive correlation between its severity and increased obesity, among the overweight and obese population. Approximately 70% of patients with hypertension have been reported to be overweight, and more than 30% of them were found to be obese. Bramlage et al. reported a strong correlation between overweight and both systolic and diastolic blood pressures. They also found that overweight reduces the effectiveness of high blood pressure treatments [11].
Kokkinos et al. found that increased physical activity with an appropriate intensity and duration can reduce blood pressure. They recommended to develop a national sports health plan as primary prevention [2]. Differences in the prevalence of hypertension are associated with social class in high income countries. The prevalence of hypertension and cardiovascular disease is lower in the upper socioeconomic classes in industrialized countries. However, the opposite relationship has been reported in South Africa. Thus, the relationship between socioeconomic status and hypertension may need to be taken into account [12].
Primatesta et al. reported a strong relationship between smoking and cardiovascular diseases that cause acute artery disease in keeping with hypertension and fat. Smoking increases blood pressure and heart rate and is associated with severe and resistant hypertension [9]. Venkataraman et al. found that smoking causes a sudden increase in blood pressure and heart rate and that heart rate remains high for more than 15 minutes in smokers [3]. The regression models are fitted with the assumption of non-collinearity and were not appropriate to use, because several factors are correlated with hypertension. A model is required to detect the correlation structures and consider the main and independent factors in the form of latent variables along with other obvious variables. For this purpose, structural equation modeling may be more appropriate.
Structural equation modeling is a general multivariate technique that allows simultaneous examination of a set of regression equations [13]. Structural equation modeling can be easily applied in complex situations that include relationships between one or more independent latent variables and one or more dependent latent variables [14-16]. Obvious variables in such models are those that can be measured directly like age and gender. Latent variables are not directly observed and are often inferred from other variables [14].
Unlike traditional regression models that consider each covariate in the model as an independent variable directly affecting increased blood pressure, structural equation modeling allows simultaneous assessment of relevant pathway of risk factors as independent and/or dependent. Studies in Iran overlooked a model of hypertension and its risk factors which can take both direct and indirect effects in order to prevent its occurrence and thereby reduce the number of injuries and disabilities caused by hypertension. Therefore, we used structural equation modeling to test our hypothesized model of risk factors for increased blood pressure using data from Mashhad Stroke and Heart Atherosclerotic Disorder (MASHAD) study.
2. Methods
Design and setting
The relevant data were extracted from the population-based MASHAD study. In this 10-year cohort study, the effect of genetic, environmental, nutritional, and psychosocial risk factors on the incidence of cardiovascular events have been explored in Eastern Iran. In MASHAD study, a sample of 9704 people were selected using stratified cluster sampling method. The age range of the participants was 35-65 years. Results of this cohort study are reported in two phases: cross-sectional data and cohort data. We used the cross-sectional data. For more information about the sampling and data gathering, refer to Ghayour and associates [17].
The following characteristics were determined by all study participants: Social economic status: Surrogate social economic status variables were determined as indicator variables, i.e. the household income per month, household educational level and the number of family members; Blood pressure: This was determined as systolic and diastolic blood pressures; Dietary factors: Some nutritional characteristics that seemed to be involved in unhealthy nutrition were entered into the model as indicators of poor nutrition. These variables included dietary saturated fat, cholesterol, sucrose and sodium; Obesity: The 2 indices presented in the scientific literature for obesity, i.e. Body Mass Index (BMI) and Waist Hip Ratio (WHR) are used as indicators of obesity; and Additional biobehavioral factors: Other variables considered in this analysis were age, physical activity, glucose, and triglycerides.
Data analysis
A structural equation model was determined to estimate the effects of risk factors for hypertension. Paths considered in the model were determined based on the theory, previous studies and opinion of medical specialists. Structural equation models typically combine measurement and structural models. Based on measurement models, the researcher defined which observed variables measuring latent variables and based on structural models, the impact of independent variables on dependent variables or correlation between variables was determined. With this model, it is possible to simultaneously assess the quality of variables measuring the acceptability of the direct and indirect effects and the confirmation of defined relations between the variables [18-21].
The structural equation modeling aims to test the hypothesis that the observed covariance matrix and covariance matrix generated from a given model is similar or not. The conceptual model was identified based on previous studies and expert opinions, relations between obesity, Socioeconomic (SE) status, poor diet and blood pressure along with the observed variables of age, glucose, triglycerides and physical activity. Age, glucose level, and obesity showed direct effects on blood pressure and SE status, poor diet, physical activity and triglycerides had indirect effects on blood pressure.
The model was as follows: After defining conceptual model, identification of model is examined. In order to unify scale indicator of each factor, one of the loading factors was considered as one. Saturated fat, systolic blood pressure, education level and BMI were indicators that their loadings were considered as one. In the next step, the appropriateness of model was considered. Using the usual goodness of fit indices, fitting of conceptual model to data was analyzed. From more than thirty evaluation indices in structural equation modeling, adjusted, CFI, TLI, NFI, RMSEA were evaluated. However, since the sample size was large, even the adjusted was also sensitive to the sample size and not reliable.
Considering the availability of maximum likelihood approaches in a large number of structural equation modeling software, FIML approach was used for the missing data. This method uses all available data to achieve the best estimate of first and second order moments and therefore generates a covariance matrix and an average vector [22-25].
3. Results
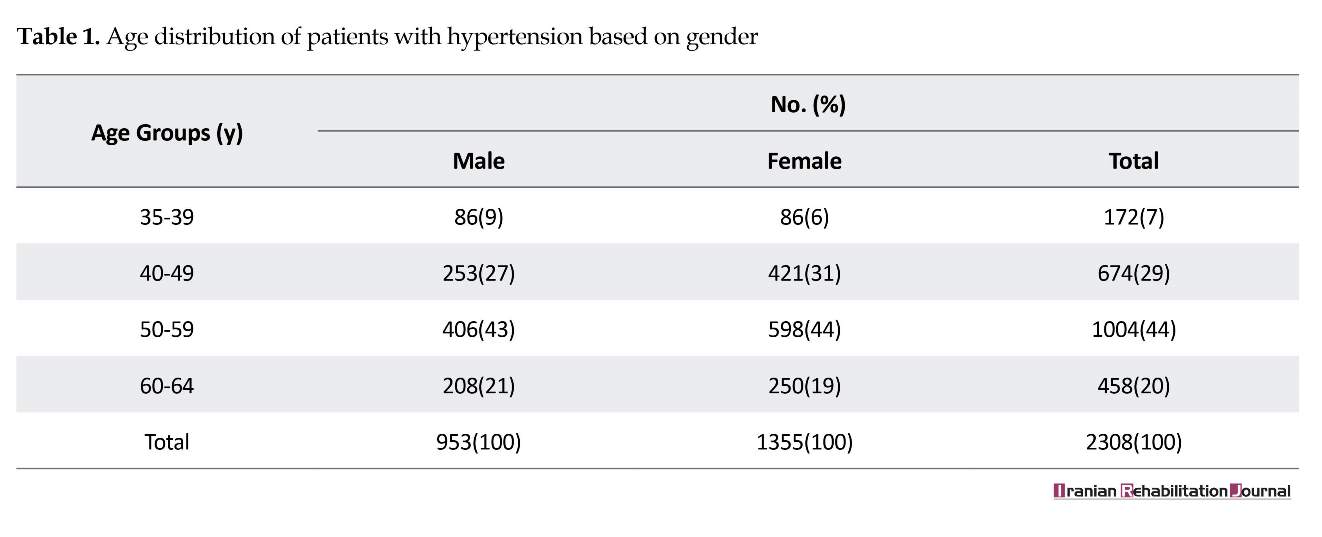
Of 9704 participants in the analysis, 40% were males and 60% were females. The mean age of the entire population was 48.1 years. Twenty-three percent of the population suffered from hypertension (diastolic blood pressure over 90 or systolic blood pressure above 140). The prevalence of hypertension was higher among men than women (13.3% vs. 24.4%). The age distribution of patients with hypertension on the basis of gender is presented in Table 1.
Some demographic indicators of this study are listed in Table 2. For other descriptive characteristics of the samples, see Ghayour et al. [17]. Because multivariate normality is one of the basic assumptions of fitting a structural equation model with maximum likelihood estimation, this assumption was tested before the analysis. Sometimes strong skewness may cause severe deviations from multivariate normality. Different transformations were used to normalize the data, and finally after examining skewness and kurtosis of transformed data, a logarithmic transform was chosen as the most appropriate.
After running the model, the conceptual model indicated an initial poor fit based on the goodness of fit measures (CFI=0.736, TLI=0.708, NFI=0.732, RMSEA=0.08, SRMR=0.068). The P values associated with SES, including poor diet, and physical activity with blood pressure, age and triglyceride and also physical activity with glucose, were lower than 0.01. Therefore, these direct effects were removed. After this modification, the model had a good fit with the sample data. Figure 1 shows final path coefficient and factor score analysis. The direct effects of age, obesity, blood pressure, and blood glucose were significant. Directions that are not meaningful are marked with dotted points.
The variables could have direct or indirect effects on a structural equation model. It is possible for a variable to lack a direct effect on other variables but have indirect effect through other variables. Socioeconomic status is
Hypertension is a prevalent chronic disease and accordingly a global major health issue. Hypertension is an important risk factor for cardiovascular diseases and studies showed that even people with slightly high blood pressure have an increased risk for cardiovascular disease [1].
The prevalence of hypertension varies between different populations. According to the World Health Organization, the number of people with hypertension is estimated to be approximately one billion, and mortality rate associated with this disease is 1.7 million people per annum, globally [2, 3]. Approximately one of every 3 adults is affected with hypertension [4]. In Iran, the prevalence of hypertension is about 25% in the whole population and 32% in adults [5].
High blood pressure may lead to microvascular and macrovascular damages, and undoubtedly hypertension-associated diseases and events are risk factors for disability [6-9]. Disability happens if an organ fails to perform its function [7]. Millions of dollars are directly spent to treat these diseases and their disabilities. Therefore, identification of risk factors for designing preventive programs is very important.
Several studies investigated the risk factors associated with hypertension. The important known risk factors for high blood pressure include age, genetic factors, overweight/obesity, smoking, high cholesterol, diabetes mellitus, and physical inactivity [4, 10]. The prevalence of hypertension is approximately 50%, and there is a positive correlation between its severity and increased obesity, among the overweight and obese population. Approximately 70% of patients with hypertension have been reported to be overweight, and more than 30% of them were found to be obese. Bramlage et al. reported a strong correlation between overweight and both systolic and diastolic blood pressures. They also found that overweight reduces the effectiveness of high blood pressure treatments [11].
Kokkinos et al. found that increased physical activity with an appropriate intensity and duration can reduce blood pressure. They recommended to develop a national sports health plan as primary prevention [2]. Differences in the prevalence of hypertension are associated with social class in high income countries. The prevalence of hypertension and cardiovascular disease is lower in the upper socioeconomic classes in industrialized countries. However, the opposite relationship has been reported in South Africa. Thus, the relationship between socioeconomic status and hypertension may need to be taken into account [12].
Primatesta et al. reported a strong relationship between smoking and cardiovascular diseases that cause acute artery disease in keeping with hypertension and fat. Smoking increases blood pressure and heart rate and is associated with severe and resistant hypertension [9]. Venkataraman et al. found that smoking causes a sudden increase in blood pressure and heart rate and that heart rate remains high for more than 15 minutes in smokers [3]. The regression models are fitted with the assumption of non-collinearity and were not appropriate to use, because several factors are correlated with hypertension. A model is required to detect the correlation structures and consider the main and independent factors in the form of latent variables along with other obvious variables. For this purpose, structural equation modeling may be more appropriate.
Structural equation modeling is a general multivariate technique that allows simultaneous examination of a set of regression equations [13]. Structural equation modeling can be easily applied in complex situations that include relationships between one or more independent latent variables and one or more dependent latent variables [14-16]. Obvious variables in such models are those that can be measured directly like age and gender. Latent variables are not directly observed and are often inferred from other variables [14].
Unlike traditional regression models that consider each covariate in the model as an independent variable directly affecting increased blood pressure, structural equation modeling allows simultaneous assessment of relevant pathway of risk factors as independent and/or dependent. Studies in Iran overlooked a model of hypertension and its risk factors which can take both direct and indirect effects in order to prevent its occurrence and thereby reduce the number of injuries and disabilities caused by hypertension. Therefore, we used structural equation modeling to test our hypothesized model of risk factors for increased blood pressure using data from Mashhad Stroke and Heart Atherosclerotic Disorder (MASHAD) study.
2. Methods
Design and setting
The relevant data were extracted from the population-based MASHAD study. In this 10-year cohort study, the effect of genetic, environmental, nutritional, and psychosocial risk factors on the incidence of cardiovascular events have been explored in Eastern Iran. In MASHAD study, a sample of 9704 people were selected using stratified cluster sampling method. The age range of the participants was 35-65 years. Results of this cohort study are reported in two phases: cross-sectional data and cohort data. We used the cross-sectional data. For more information about the sampling and data gathering, refer to Ghayour and associates [17].
The following characteristics were determined by all study participants: Social economic status: Surrogate social economic status variables were determined as indicator variables, i.e. the household income per month, household educational level and the number of family members; Blood pressure: This was determined as systolic and diastolic blood pressures; Dietary factors: Some nutritional characteristics that seemed to be involved in unhealthy nutrition were entered into the model as indicators of poor nutrition. These variables included dietary saturated fat, cholesterol, sucrose and sodium; Obesity: The 2 indices presented in the scientific literature for obesity, i.e. Body Mass Index (BMI) and Waist Hip Ratio (WHR) are used as indicators of obesity; and Additional biobehavioral factors: Other variables considered in this analysis were age, physical activity, glucose, and triglycerides.
Data analysis
A structural equation model was determined to estimate the effects of risk factors for hypertension. Paths considered in the model were determined based on the theory, previous studies and opinion of medical specialists. Structural equation models typically combine measurement and structural models. Based on measurement models, the researcher defined which observed variables measuring latent variables and based on structural models, the impact of independent variables on dependent variables or correlation between variables was determined. With this model, it is possible to simultaneously assess the quality of variables measuring the acceptability of the direct and indirect effects and the confirmation of defined relations between the variables [18-21].
The structural equation modeling aims to test the hypothesis that the observed covariance matrix and covariance matrix generated from a given model is similar or not. The conceptual model was identified based on previous studies and expert opinions, relations between obesity, Socioeconomic (SE) status, poor diet and blood pressure along with the observed variables of age, glucose, triglycerides and physical activity. Age, glucose level, and obesity showed direct effects on blood pressure and SE status, poor diet, physical activity and triglycerides had indirect effects on blood pressure.
The model was as follows: After defining conceptual model, identification of model is examined. In order to unify scale indicator of each factor, one of the loading factors was considered as one. Saturated fat, systolic blood pressure, education level and BMI were indicators that their loadings were considered as one. In the next step, the appropriateness of model was considered. Using the usual goodness of fit indices, fitting of conceptual model to data was analyzed. From more than thirty evaluation indices in structural equation modeling, adjusted, CFI, TLI, NFI, RMSEA were evaluated. However, since the sample size was large, even the adjusted was also sensitive to the sample size and not reliable.
Considering the availability of maximum likelihood approaches in a large number of structural equation modeling software, FIML approach was used for the missing data. This method uses all available data to achieve the best estimate of first and second order moments and therefore generates a covariance matrix and an average vector [22-25].
3. Results
Of 9704 participants in the analysis, 40% were males and 60% were females. The mean age of the entire population was 48.1 years. Twenty-three percent of the population suffered from hypertension (diastolic blood pressure over 90 or systolic blood pressure above 140). The prevalence of hypertension was higher among men than women (13.3% vs. 24.4%). The age distribution of patients with hypertension on the basis of gender is presented in Table 1.
Some demographic indicators of this study are listed in Table 2. For other descriptive characteristics of the samples, see Ghayour et al. [17]. Because multivariate normality is one of the basic assumptions of fitting a structural equation model with maximum likelihood estimation, this assumption was tested before the analysis. Sometimes strong skewness may cause severe deviations from multivariate normality. Different transformations were used to normalize the data, and finally after examining skewness and kurtosis of transformed data, a logarithmic transform was chosen as the most appropriate.
After running the model, the conceptual model indicated an initial poor fit based on the goodness of fit measures (CFI=0.736, TLI=0.708, NFI=0.732, RMSEA=0.08, SRMR=0.068). The P values associated with SES, including poor diet, and physical activity with blood pressure, age and triglyceride and also physical activity with glucose, were lower than 0.01. Therefore, these direct effects were removed. After this modification, the model had a good fit with the sample data. Figure 1 shows final path coefficient and factor score analysis. The direct effects of age, obesity, blood pressure, and blood glucose were significant. Directions that are not meaningful are marked with dotted points.
The variables could have direct or indirect effects on a structural equation model. It is possible for a variable to lack a direct effect on other variables but have indirect effect through other variables. Socioeconomic status is
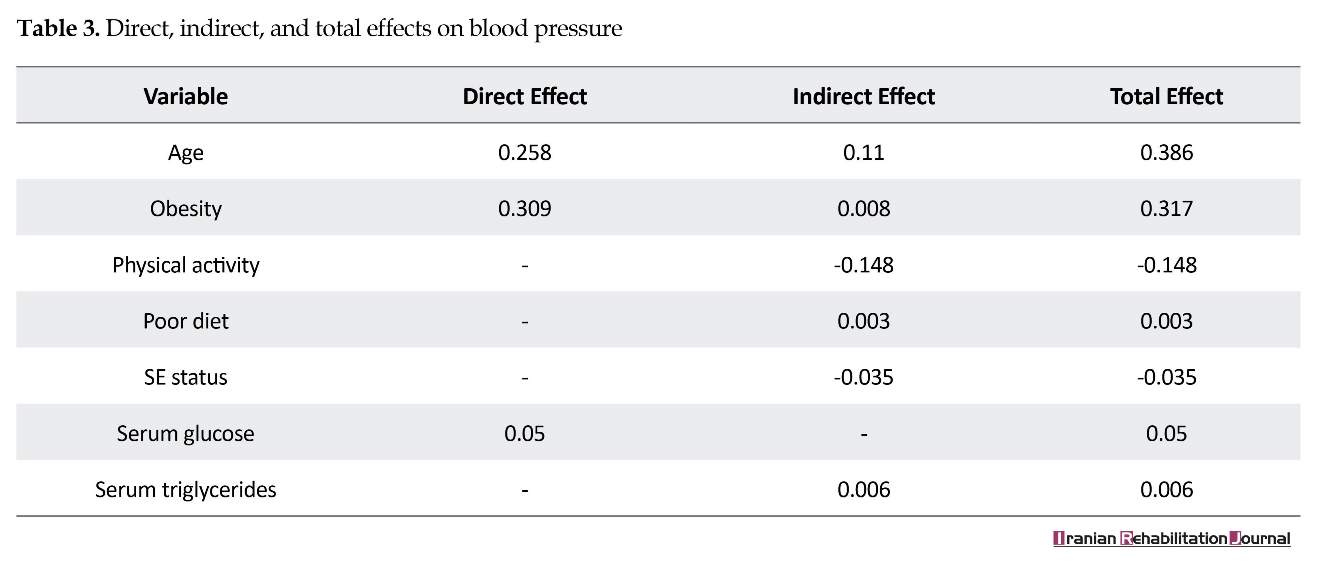
one of such variables, in the model we defined. Also, the effect of one variable on another may be enhanced with indirect effects. Calculating indirect effects and thus calculating the total effects between variables is an advantage of the structural equation modeling technique. Direct, indirect, and total effects are presented in Table 3.
Socioeconomic status has an indirect effect (rather than a direct effect) on blood pressure. The total effects show that age has the greatest impact on blood pressure. Physical activity has no direct effect on blood pressure but its indirect effect is relatively high. The negative value indicates that blood pressure is reduced with increased physical activity.
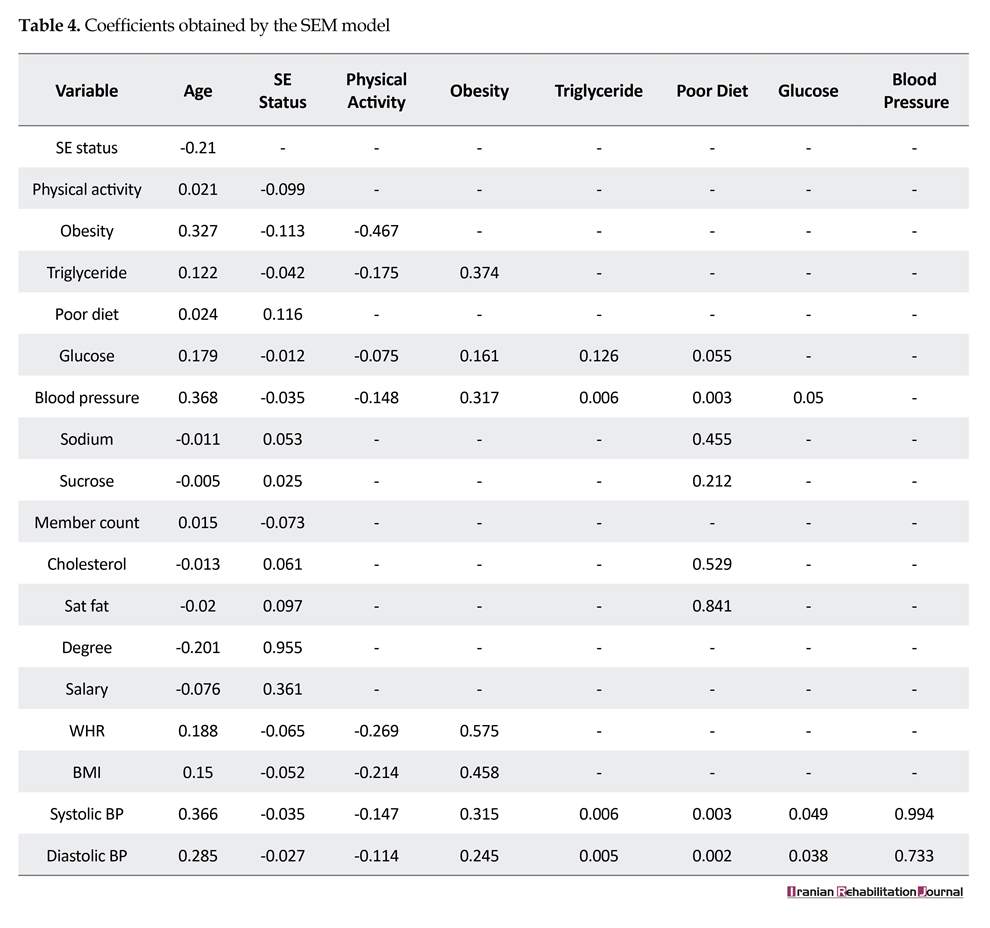
The total effects of variables are presented in Table 4. Coefficients show that the risk of obesity is strongly reduced with physical activity. Also, Physical activity reduces the level of triglycerides. Obesity has a greater impact on systolic blood pressure in comparison with diastolic blood pressure. On the whole, all variables had more impact on systolic blood pressure than diastolic blood pressure.
4. Discussion
Hypertension is the most prevalent risk factor for cardiovascular disease leading to myocardial infarction, stroke, heart failure, microvascular disease, renal failure, and early death. Previous studies showed an increased chance of developing cardiovascular diseases even in
Socioeconomic status has an indirect effect (rather than a direct effect) on blood pressure. The total effects show that age has the greatest impact on blood pressure. Physical activity has no direct effect on blood pressure but its indirect effect is relatively high. The negative value indicates that blood pressure is reduced with increased physical activity.
The total effects of variables are presented in Table 4. Coefficients show that the risk of obesity is strongly reduced with physical activity. Also, Physical activity reduces the level of triglycerides. Obesity has a greater impact on systolic blood pressure in comparison with diastolic blood pressure. On the whole, all variables had more impact on systolic blood pressure than diastolic blood pressure.
4. Discussion
Hypertension is the most prevalent risk factor for cardiovascular disease leading to myocardial infarction, stroke, heart failure, microvascular disease, renal failure, and early death. Previous studies showed an increased chance of developing cardiovascular diseases even in
The paths that are not meaningful are marked with dashes.
people with blood pressure of slightly above the normal range. There is a need for new models to identify risk factors for hypertension, because of the high prevalence of this disease. Therefore, we tried to consider a statistical model to look for the effects of such factors that enhance the risk of disease in all populations, including healthy, at risk, or suffering from hypertension.
The current investigation was based on a predictive model using a cross-sectional study to identify direct and indirect effects of hypertension risk factors. In this regard, some of these factors were selected based on the previous studies and expert opinions. Hypertension was defined as the latent response variable and obesity, socioeconomic status, and poor diet variables were defined
as latent predictors. In addition, age was assumed as an exogenous variable. Glucose and triglycerides were also added to the model as mediator variables.
These variables were selected in consistent with other studies. For example, in the study of Bardenheier, nutritional factors were determined using variables such as total sugar, solid fat, vegetable consumption, saturated fat, red meat, and processed meat. Also, the number of family members, family income, marital status and educational level were considered as the indicators of the latent socioeconomic status variable [26].
Cois et al. analyzed the economic and social aspects of systolic and diastolic blood pressure as latent variables. In their study, income, education, body mass index, alcohol consumption, smoking and physical activity were frequently observed variables that affect latent blood pressure variables [12]. Shen et al. reported that in the case of metabolic syndrome, obesity depends on two variables of body mass index and waist-hip circumference, and blood pressure has been considered on the basis of systolic and diastolic pressure [27]. Nock and colleagues defined blood pressure as a latent variable in a study on the subject of metabolic syndrome with systolic blood pressure and diastolic blood pressure as observed variables [28].
Basic structural equation model was fitted using the MLR method and then the goodness of fit indexes were evaluated. According to the value of these indices, the proposed model poorly fitted to the data. P values associated with SES, poor diet, and physical activity with blood pressure and also age and triglyceride were lower than 0.01, therefore, these direct effects were removed. After this modification, the model fitted well with the sample data. Because the sample size was high and Chi-square index is highly sensitive to the sample size and in this situation even the modified Chi-square index is not reliable, this parameter was not considered in the determination of model goodness of fit. CFI and TLI and NFI index values greater than 0.9, as well as RMSEA and SRMR values less than 0.05 showed appropriateness of conceptual model in this study.
After modifying the model, systolic blood pressure factor loading was more than diastolic blood pressure and therefore it is considered more important. Parameter estimation showed that age, obesity, and lack of physical activity are factors that increase the risk for hypertension. This finding is consistent with prior research. Bramlag et al. reported a strong relationship between systolic blood pressure and diastolic blood pressure in both groups with hypertension and those with low blood pressure. Also, overweight decreases the effect of treatment to control hypertension [11].
The current study also demonstrated that the effect of obesity on blood pressure is high with a positive coefficient. Therefore, weight control can prevent the development of hypertension. The structural equation modeling technique revealed that obesity had a slight indirect effect on blood pressure through glucose. Moreover, Kokinos et al. showed that increased intensity and duration of physical activity reduces blood pressure. Based on this study, increased physical activity had no direct effect on blood pressure, but this variable is affected by obesity on blood pressure. Thus, physical activity reduces the weight and blood pressure. Physical activity showed a relatively high indirect effect on blood pressure. Therefore, sports program should be given priority for a national health primary prevention plan [2].
Mosavian et al. examined the effects of a specific physical activity on overweight menopausal women. In their study, physical activity decreased systolic and diastolic blood pressure [29]. This study demonstrated that WHR factor loading was higher than BMI. Thus, WHR appears to be more appropriate to show obesity. In a systematic review by Yang et al., there was a positive association between waist-to-height and waist-to-hip ratio, and cardiovascular disease [30]. This study is consistent with previous studies.
The results showed risk factors that do not directly increase blood pressure but indirectly affect it. For example, although physical activity and diet may not directly increase blood pressure, they might be affected by other variables and cannot be ignored. While, a typical regression model that does not take indirect effects is not able to demonstrate these effects and may lead to the elimination of these variables from the risk factors of hypertension.
Assessing coefficients of fitted model in Table 4 showed that as the amount of salt, saturated fat and cholesterol increased, the diet of the people was poorer, and this diet was directly related to their socioeconomic status. However, BMI and WHR had a negative correlation with SES. This is perhaps due to the fact that people from higher social classes try to be fitter.
In Micklesfield study, association between SES, physical activity, and sedentary time, and how they predict adiposity were examined in rural South African women. In their study, a structural equation model with BMI and waist variables was proposed and examined. Their results showed that overweight and obesity had a higher prevalence in urban society, and moderate-vigorous physical activity was lower in urban samples [8]. In conclusion, their results were inconsistent with ours.
This study applied structural equation modeling to examine hypertension risk factors. Our findings highlighted the value of direct and indirect effects on this matter. The only limitation of the present study was spending a lot of time to refine and prepare data due to the large volume of the data. There is a great need to continue research in other areas and other risk factors to help adopt people’s behaviors and modify preventive policies. Future studies should examine other risk factors and conduct research with respect to gender and to identify the significant differences between the two genders.
5. Conclusion
The structural equation modeling technique evaluated the quality and acceptability of direct and indirect effects and defined interaction between the variables. The final model estimations showed that age, obesity and physical activity were the most important influencing factors on increased blood pressure, respectively. Age and obesity both had direct and indirect effects by other variables in the variation of blood pressure. However, physical activity had an indirect effect on blood pressure. These indirect effects cannot be identified using conventional models. Practicing a healthy lifestyle, including sufficient physical activity and preventing obesity are essential for the prevention and management of hypertension. Furthermore, WHR seems to be a better indicator of obesity than BMI.
Ethical Considerations
Compliance with ethical guidelines
This study was approved by the Ethics Committee of Mashhad University of Medical Sciences (IR.MUMS.REC.1394.549, 2015-12-02).
Funding
This research was part of a Master’s thesis of Razieh Yousefi in Department of Epidemiology & Biostatistics in Health School of Mashhad University of Medical Sciences. It was supported by Mashhad University of Medical Sciences.
Conflict of interest
The authors certify that they have no affiliation with or involvement in any organization or entity with any financial, or non-financial interest in the subject matter or materials dismissed in this manuscript.
Acknowledgements
The authors appreciate the Vice-Chancellor of Mashhad University of Medical Sciences for the support during this research project. We would also like to show our gratitude to the Faculty Members of Epidemiology and Biostatistics Department of Mashhad University of Medical Sciences for sharing their pearls of wisdom with us during the course of this research.
References
- Lifton RP, Gharavi AG, Geller DS. Molecular mechanisms of human hypertension. Cell. 2001; 104(4):545-56. [DOI:10.1016/S0092-8674(01)00241-0]
- Kokkinos PF, Giannelou A, Manolis A, Pittaras A. Physical activity in the prevention and management of high blood pressure. Hellenic Journal of Cardiology. 2009; 50(1):52-9. [PMID]
- Venkataraman R, Satish Kumar BP, Kumaraswamy M, Singh R, Pandey M, Tripathi P. Smoking, alcohol and hypertension. International Journal of Pharmacy and Pharmaceutical Sciences. 2013; 5(4):28-32.
- World Health Organization. A global brief on hypertension: Silent killer, global public health crisis 2016. Geneva: World Health Organization; 2016.
- Javadi HR. [The prevalence of hypertension in people over 20 years of Qazvin (Persian)]. The Journal of Qazvin University of Medical Sciences. 1999; 3(1):23-9.
- Erkinjuntti T, Gauthier S. Vascular cause of cognitive impairment-the perspective. London: Martin Dunitz; 2002.
- Merrill FE, Penelope KE. Blood pressure and disability. Hypertension. 2007; 50(6):1006-8. [DOI:10.1161/HYPERTENSIONAHA.107.100883] [PMID]
- Micklesfield LK, Munthali RJ, Prioreschi A, Said-Mohamed R, van Heerden A, Tollman S, et al. Understanding the relationship between socio-economic status, physical activity and sedentary behaviour, and adiposity in young adult South African women using structural equation modelling. International Journal of Environmental Research and Public Health. 2017; 14(10):1271. [DOI:10.3390/ijerph14101271] [PMID] [PMCID]
- Primatesta P, Falaschetti E, Gupta S, Marmot MG, Poulter NR. Association between smoking and blood pressure: Evidence from the health survey for England. Hypertension. 2001; 37(2):187-93. [DOI:10.1161/01.HYP.37.2.187] [PMID]
- Awosan K, Ibrahim M, Essien E, Yusuf A, Okolo A. Dietary pattern, lifestyle, nutrition status and prevalence of hypertension among traders in Sokoto Central market, Sokoto, Nigeria. International Journal of Nutrition and Metabolism. 2014; 6(1):9-17. [DOI:10.5897/IJNAM2013.0158]
- Bramlage P, Pittrow D, Wittchen HU, Kirch W, Boehler S, Lehnert H, et al. Hypertension in overweight and obese primary care patients is highly prevalent and poorly controlled. American Journal of Hypertension. 2004; 17(10):904-10. [DOI:10.1016/j.amjhyper.2004.05.017] [PMID]
- Cois A, Ehrlich R. Analysing the socioeconomic determinants of hypertension in South Africa: A structural equation modelling approach. BMC Public Health. 2014; 14:414. [DOI:10.1186/1471-2458-14-414]
- Hooman HA. [Structural equation modeling with LISREL application (Persian)]. Tehran: SAMT Publication; 2009.
- Altindag I, Genc A. Bayesian nonlinear structural equation modeling. Journal of Selcuk University Natural and Applied Science. 2015; 4(1):174-92.
- Song XY, Xia YM, Lee SY. Bayesian semiparametric analysis of structural equation models with mixed continuous and unordered categorical variables. Statistics in Medicine. 2009; 28(17):2253-76. [DOI:10.1002/sim.3612] [PMID]
- Ullman JB. Structural equation modeling: Reviewing the basics and moving forward. Journal of Personality Assessment. 2006; 87(1):35-50. [DOI:10.1207/s15327752jpa8701_03] [PMID]
- Ghayour-Mobarhan M, Moohebati M, Esmaily H, Ebrahimi M, Parizadeh SM, Heidari-Bakavoli AR, et al. Mashhad stroke and heart atherosclerotic disorder (MASHAD) study: Design, baseline characteristics and 10-year cardiovascular risk estimation. International Journal of Public Health. 2015; 60(5):561-72. [DOI:10.1007/s00038-015-0679-6] [PMID]
- Joreskog, KG, Sorbom D. PRELIS 2: User’s reference guide. Chicago: Scientific Software International; 1999.
- Jöreskog KG. A general method for estimating a linear structural equation system. ETS Research Bulletin Series. 1970; 1970(2):i-41.
- Kaplan D. Structural equation modeling: Foundations and extensions. Thousand Oaks, California: SAGA Publications; 2008.
- Muthén LK, Muthén BO. Mplus user’s guide. Los Angeles, CA: Muthén & Muthén; 2010.
- Brown RL. Efficacy of the indirect approach for estimating structural equation models with missing data: A comparison of five methods. Structural Equation Modeling: A Multidisciplinary Journal. 1994; 1(4):287-316. [DOI:10.1080/10705519409539983]
- Kim JO, Curry J. The treatment of missing data in multivariate analysis. Sociological Methods & Research. 1977; 6(2):215-40. [DOI:10.1177/004912417700600206]
- Little RJ, Rubin DB. Statistical analysis with missing data. Hoboken, New Jersey: John Wiley & Sons; 2014.
- Song XY, Lee SY. Analysis of structural equation model with ignorable missing continuous and polytomous data. Psychometrika. 2002; 67(2):261-88. [DOI:10.1007/BF02294846]
- Bardenheier BH, Bullard KM, Caspersen CJ, Cheng YJ, Gregg EW, Geiss LS. A novel use of structural equation models to examine factors associated with prediabetes among adults aged 50 years and older: National Health and Nutrition Examination Survey 2001-2006. Diabetes Care. 2013; 36(9):2655-62. [DOI:10.2337/dc12-2608] [PMID] [PMCID]
- Shen BJ, Todaro JF, Niaura R, McCaffery JM, Zhang J, Spiro A, et al. Are metabolic risk factors one unified syndrome? Modeling the structure of the metabolic syndrome X. American Journal of Epidemiology. 2003; 157(8):701-11. [DOI:10.1093/aje/kwg045] [PMID]
- Nock NL, Wang X, Thompson CL, Song Y, Baechle D, Raska P, et al. Defining genetic determinants of the Metabolic Syndrome in the Framingham heart study using association and structural equation modeling methods. BMC Proceedings. 2009; 3(7):S50. [DOI:10.1186/1753-6561-3-s7-s50]
- Sadat Mousavian A, Ganbarzadeh M, Namvar F, Shakerian S. [Comparing effect of walking and selected aerobic exercise on blood pressure in overweight postmenopausal women (Persian)]. Journal of Urmia Nursing and Midwifery Faculty. 2014; 12(6):427-35.
- Yang Q, Zhong Y, Merritt R, Cogswell ME. Trends in high blood pressure among United States adolescents across body weight category between 1988 and 2012. The Journal of Pediatrics. 2016; 169:166-73. [DOI:10.1016/j.jpeds.2015.10.007]
Article type: Original Research Articles |
Subject:
Biostatistics
Received: 2018/01/24 | Accepted: 2018/07/20 | Published: 2018/09/1
Received: 2018/01/24 | Accepted: 2018/07/20 | Published: 2018/09/1
References
1. Lifton RP, Gharavi AG, Geller DS. Molecular mechanisms of human hypertension. Cell. 2001; 104(4):545-56. [DOI:10.1016/S0092-8674(01)00241-0] [DOI:10.1016/S0092-8674(01)00241-0]
2. Kokkinos PF, Giannelou A, Manolis A, Pittaras A. Physical activity in the prevention and management of high blood pressure. Hellenic Journal of Cardiology. 2009; 50(1):52-9. [PMID] [PMID]
3. Venkataraman R, Satish Kumar BP, Kumaraswamy M, Singh R, Pandey M, Tripathi P. Smoking, alcohol and hypertension. International Journal of Pharmacy and Pharmaceutical Sciences. 2013; 5(4):28-32.
4. World Health Organization. A global brief on hypertension: Silent killer, global public health crisis 2016. Geneva: World Health Organization; 2016.
5. Javadi HR. [The prevalence of hypertension in people over 20 years of Qazvin (Persian)]. The Journal of Qazvin University of Medical Sciences. 1999; 3(1):23-9.
6. Erkinjuntti T, Gauthier S. Vascular cause of cognitive impairment-the perspective. London: Martin Dunitz; 2002.
7. Merrill FE, Penelope KE. Blood pressure and disability. Hypertension. 2007; 50(6):1006-8. [DOI:10.1161/HYPERTENSIONAHA.107.100883] [PMID] [DOI:10.1161/HYPERTENSIONAHA.107.100883]
8. Micklesfield LK, Munthali RJ, Prioreschi A, Said-Mohamed R, van Heerden A, Tollman S, et al. Understanding the relationship between socio-economic status, physical activity and sedentary behaviour, and adiposity in young adult South African women using structural equation modelling. International Journal of Environmental Research and Public Health. 2017; 14(10):1271. [DOI:10.3390/ijerph14101271] [PMID] [PMCID] [DOI:10.3390/ijerph14101271]
9. Primatesta P, Falaschetti E, Gupta S, Marmot MG, Poulter NR. Association between smoking and blood pressure: Evidence from the health survey for England. Hypertension. 2001; 37(2):187-93. [DOI:10.1161/01.HYP.37.2.187] [PMID] [DOI:10.1161/01.HYP.37.2.187]
10. Awosan K, Ibrahim M, Essien E, Yusuf A, Okolo A. Dietary pattern, lifestyle, nutrition status and prevalence of hypertension among traders in Sokoto Central market, Sokoto, Nigeria. International Journal of Nutrition and Metabolism. 2014; 6(1):9-17. [DOI:10.5897/IJNAM2013.0158] [DOI:10.5897/IJNAM2013.0158]
11. Bramlage P, Pittrow D, Wittchen HU, Kirch W, Boehler S, Lehnert H, et al. Hypertension in overweight and obese primary care patients is highly prevalent and poorly controlled. American Journal of Hypertension. 2004; 17(10):904-10. [DOI:10.1016/j.amjhyper.2004.05.017] [PMID] [DOI:10.1016/j.amjhyper.2004.05.017]
12. Cois A, Ehrlich R. Analysing the socioeconomic determinants of hypertension in South Africa: A structural equation modelling approach. BMC Public Health. 2014; 14:414. [DOI:10.1186/1471-2458-14-414] [DOI:10.1186/1471-2458-14-414]
13. Hooman HA. [Structural equation modeling with LISREL application (Persian)]. Tehran: SAMT Publication; 2009.
14. Altindag I, Genc A. Bayesian nonlinear structural equation modeling. Journal of Selcuk University Natural and Applied Science. 2015; 4(1):174-92.
15. Song XY, Xia YM, Lee SY. Bayesian semiparametric analysis of structural equation models with mixed continuous and unordered categorical variables. Statistics in Medicine. 2009; 28(17):2253-76. [DOI:10.1002/sim.3612] [PMID] [DOI:10.1002/sim.3612]
16. Ullman JB. Structural equation modeling: Reviewing the basics and moving forward. Journal of Personality Assessment. 2006; 87(1):35-50. [DOI:10.1207/s15327752jpa8701_03] [PMID] [DOI:10.1207/s15327752jpa8701_03]
17. Ghayour-Mobarhan M, Moohebati M, Esmaily H, Ebrahimi M, Parizadeh SM, Heidari-Bakavoli AR, et al. Mashhad stroke and heart atherosclerotic disorder (MASHAD) study: Design, baseline characteristics and 10-year cardiovascular risk estimation. International Journal of Public Health. 2015; 60(5):561-72. [DOI:10.1007/s00038-015-0679-6] [PMID] [DOI:10.1007/s00038-015-0679-6]
18. Joreskog, KG, Sorbom D. PRELIS 2: User's reference guide. Chicago: Scientific Software International; 1999.
19. Jöreskog KG. A general method for estimating a linear structural equation system. ETS Research Bulletin Series. 1970; 1970(2):i-41. [DOI:10.1002/j.2333-8504.1970.tb00783.x]
20. Kaplan D. Structural equation modeling: Foundations and extensions. Thousand Oaks, California: SAGA Publications; 2008.
21. Muthén LK, Muthén BO. Mplus user's guide. Los Angeles, CA: Muthén & Muthén; 2010. [PMCID]
22. Brown RL. Efficacy of the indirect approach for estimating structural equation models with missing data: A comparison of five methods. Structural Equation Modeling: A Multidisciplinary Journal. 1994; 1(4):287-316. [DOI:10.1080/10705519409539983] [DOI:10.1080/10705519409539983]
23. Kim JO, Curry J. The treatment of missing data in multivariate analysis. Sociological Methods & Research. 1977; 6(2):215-40. [DOI:10.1177/004912417700600206] [DOI:10.1177/004912417700600206]
24. Little RJ, Rubin DB. Statistical analysis with missing data. Hoboken, New Jersey: John Wiley & Sons; 2014.
25. Song XY, Lee SY. Analysis of structural equation model with ignorable missing continuous and polytomous data. Psychometrika. 2002; 67(2):261-88. [DOI:10.1007/BF02294846] [DOI:10.1007/BF02294846]
26. Bardenheier BH, Bullard KM, Caspersen CJ, Cheng YJ, Gregg EW, Geiss LS. A novel use of structural equation models to examine factors associated with prediabetes among adults aged 50 years and older: National Health and Nutrition Examination Survey 2001-2006. Diabetes Care. 2013; 36(9):2655-62. [DOI:10.2337/dc12-2608] [PMID] [PMCID] [DOI:10.2337/dc12-2608]
27. Shen BJ, Todaro JF, Niaura R, McCaffery JM, Zhang J, Spiro A, et al. Are metabolic risk factors one unified syndrome? Modeling the structure of the metabolic syndrome X. American Journal of Epidemiology. 2003; 157(8):701-11. [DOI:10.1093/aje/kwg045] [PMID] [DOI:10.1093/aje/kwg045]
28. Nock NL, Wang X, Thompson CL, Song Y, Baechle D, Raska P, et al. Defining genetic determinants of the Metabolic Syndrome in the Framingham heart study using association and structural equation modeling methods. BMC Proceedings. 2009; 3(7):S50. [DOI:10.1186/1753-6561-3-s7-s50] [DOI:10.1186/1753-6561-3-s7-s50]
29. Sadat Mousavian A, Ganbarzadeh M, Namvar F, Shakerian S. [Comparing effect of walking and selected aerobic exercise on blood pressure in overweight postmenopausal women (Persian)]. Journal of Urmia Nursing and Midwifery Faculty. 2014; 12(6):427-35.
30. Yang Q, Zhong Y, Merritt R, Cogswell ME. Trends in high blood pressure among United States adolescents across body weight category between 1988 and 2012. The Journal of Pediatrics. 2016; 169:166-73. [DOI:10.1016/j.jpeds.2015.10.007] [DOI:10.1016/j.jpeds.2015.10.007]
Send email to the article author

Copyright © The Author(s);
This is an open access article distributed under the terms of the Creative Commons Attribution License (CC-By-NC), which permits use, distribution, and reproduction in any medium, provided the original work is properly cited and is not used for commercial purposes.
Contact Information
