
988368
Tue, Oct 27, 2026

Volume 24, Issue 3 (September 2026)
Iranian Rehabilitation Journal 2026, 24(3): 333-344 |
Back to browse issues page



Ethics code: IR.USWR.REC1403.119


Download citation:
BibTeX | RIS | EndNote | Medlars | ProCite | Reference Manager | RefWorks
Send citation to:


BibTeX | RIS | EndNote | Medlars | ProCite | Reference Manager | RefWorks
Send citation to:
Kazemi T, Darouie A, Zarifian T, Ahadi M, Vahedi M. Task-specific Phonological Processing in Children With Unilateral Hearing Loss in Quiet and Noise. Iranian Rehabilitation Journal 2026; 24 (3) :333-344
URL: http://irj.uswr.ac.ir/article-1-2741-en.html
URL: http://irj.uswr.ac.ir/article-1-2741-en.html

1- Department of Speech Therapy, Faculty of Rehabilitation Sciences, University of Social Welfare and Rehabilitation Sciences, Tehran, Iran.
2- Department of Speech Therapy, Faculty of Rehabilitation Sciences, University of Social Welfare and Rehabilitation Sciences, Tehran, Iran. & Pediatric Neurorehabilitation Research Center, University of Social Welfare and Rehabilitation Sciences, Tehran, Iran.
3- Department of Audiology,Rehabilitation Research Center, School of Rehabilitation Sciences, Iran University of Medical Sciences, Tehran, Iran.
4- Department of Biostatistics and Epidemiology, Substance Abuse and Dependence Research Center, Faculty of Social Health, University of Social Welfare and Rehabilitation Sciences, Tehran, Iran.
Keywords: Unilateral hearing loss (UHL), Phonological awareness, Noise, Children, Auditory perception
Full-Text [PDF 599 kb]
(127 Downloads)
| Abstract (HTML) (1192 Views)
References
Full-Text: (34 Views)
Introduction
Hearing is a fundamental sensory modality that supports the development of speech, language, and academic skills. Auditory processing involves receiving acoustic signals in the peripheral auditory system and encoding them in central auditory pathways [1, 2]. Binaural hearing enhances speech perception, particularly in noisy environments, through mechanisms, such as binaural summation, the head shadow effect, and release from masking [3].
Unilateral hearing loss (UHL), defined as normal hearing (≤15 dB HL) in one ear and sensorineural hearing loss in the contralateral ear, reduces the benefits of binaural processing [4, 5]. Although one normal-hearing ear was previously considered sufficient for typical development, evidence indicates that children with UHL are at risk for delays in speech and language development, as well as deficits in auditory processing and academic performance [6–8]. Children with UHL also demonstrate poorer performance in speech perception in noise, temporal auditory processing, and phonological and language-related tasks [4, 9, 10].
Phonological awareness is a core skill underlying language development and early reading acquisition and depends on precise and stable auditory input [11]. Disruptions in auditory input, especially under noisy conditions, may impair the formation of stable phonological representations and increase reliance on cognitive resources such as working memory [12, 13]. Children with UHL have demonstrated difficulties in temporal auditory processing [4, 10], and temporal-processing limitations may negatively affect phonological awareness skills, including phoneme identification and manipulation [14].
Nonword-based tasks are sensitive measures of phonological processing because they require the encoding, temporary storage, and manipulation of novel sound sequences with minimal support from lexical knowledge [15]. Previous studies have also reported poorer speech perception in noise in children with UHL [16, 17], as well as difficulties in phonological, vocabulary, and broader language outcomes [18, 19]. One study further showed that children with UHL had greater difficulty with novel-word learning, particularly under noisy listening conditions [20]. However, it remains unclear which levels of phonological manipulation are most affected.
Accordingly, the present study aimed to compare different phonological manipulation subskills across listening conditions and grade levels in children with UHL and their normal-hearing peers.
Materials and Methods
Study design and participants
This comparative cross-sectional study included 26 Persian-speaking first- and second-grade children aged 6-8 years in Tehran, Iran. Participants were divided into two hearing-status groups: children with UHL (n=13) and normal-hearing peers (NH; n=13). Each participant completed five nonword-based phonological awareness subtests under both noise and quiet listening conditions. Analyses were conducted at three levels: 1) comparisons between the UHL and NH groups within each grade and listening condition; 2) comparisons between first- and second-grade children within each hearing-status group and listening condition; and 3) within-participant comparisons between noise and quiet conditions within each grade and hearing-status group.
Sample size estimation
Sample size was calculated using G*Power software, version 3.1, assuming an effect size of d=0.8, α=0.05, and power=0.8. The minimum required sample size was 13 participants per hearing-status group, for a total of 26 participants.
Inclusion and exclusion criteria
Participants were Persian-speaking children with congenital or early-acquired unilateral sensorineural hearing loss before age 2. Children in the UHL group had hearing thresholds greater than 41 dB HL in the affected ear and ≤15 dB HL in the contralateral ear. Children who used hearing aids were excluded to reduce heterogeneity associated with amplification history, device fitting, duration and consistency of use, and aided audibility. Other exclusion criteria included neurological disorders, autism spectrum disorder, attention-deficit/hyperactivity disorder, intellectual disability, and visual impairment. Participants with a backward digit span of two digits or greater were eligible for inclusion, whereas those with a span below two digits were excluded. The NH group met the same eligibility criteria but had bilateral hearing thresholds ≤15 dB HL.
Procedures
After obtaining ethical approval and written parental consent, demographic, medical, and audiological information was collected. The Backward Digit Span test was administered before the phonological awareness assessment. Testing was conducted in a 12 m² classroom-like room. The quiet condition was not treated as a baseline. The fixed order was selected to prevent task-related fatigue from disproportionately affecting performance under the more demanding noise condition. However, because the order was not counterbalanced, possible practice, stimulus-familiarity, and order effects cannot be excluded. Therefore, comparisons between noise and quiet conditions should be interpreted cautiously.
In the noise condition, standardized Persian eight-talker babble noise was presented from the two lateral loudspeakers, while the test stimuli were presented from the front loudspeaker. Speech and noise were presented at 65 dB SPL and 60 dB SPL, respectively, resulting in a signal-to-noise ratio of +5 dB [16, 17, 21]. Three loudspeakers were positioned at 0°, +90°, and −90° relative to the child [16]. The distance between the child and each loudspeaker was 1 meter, and the loudspeakers were positioned at ear level. Sound levels were calibrated using a Type 1 sound level meter [22]. In the quiet condition, only the front loudspeaker was active, and ambient noise was maintained below 40 dB [23]. All test stimuli were pre-recorded to control for visual and intensity-related cues. The total testing time was approximately 45–60 minutes.
Nonword development
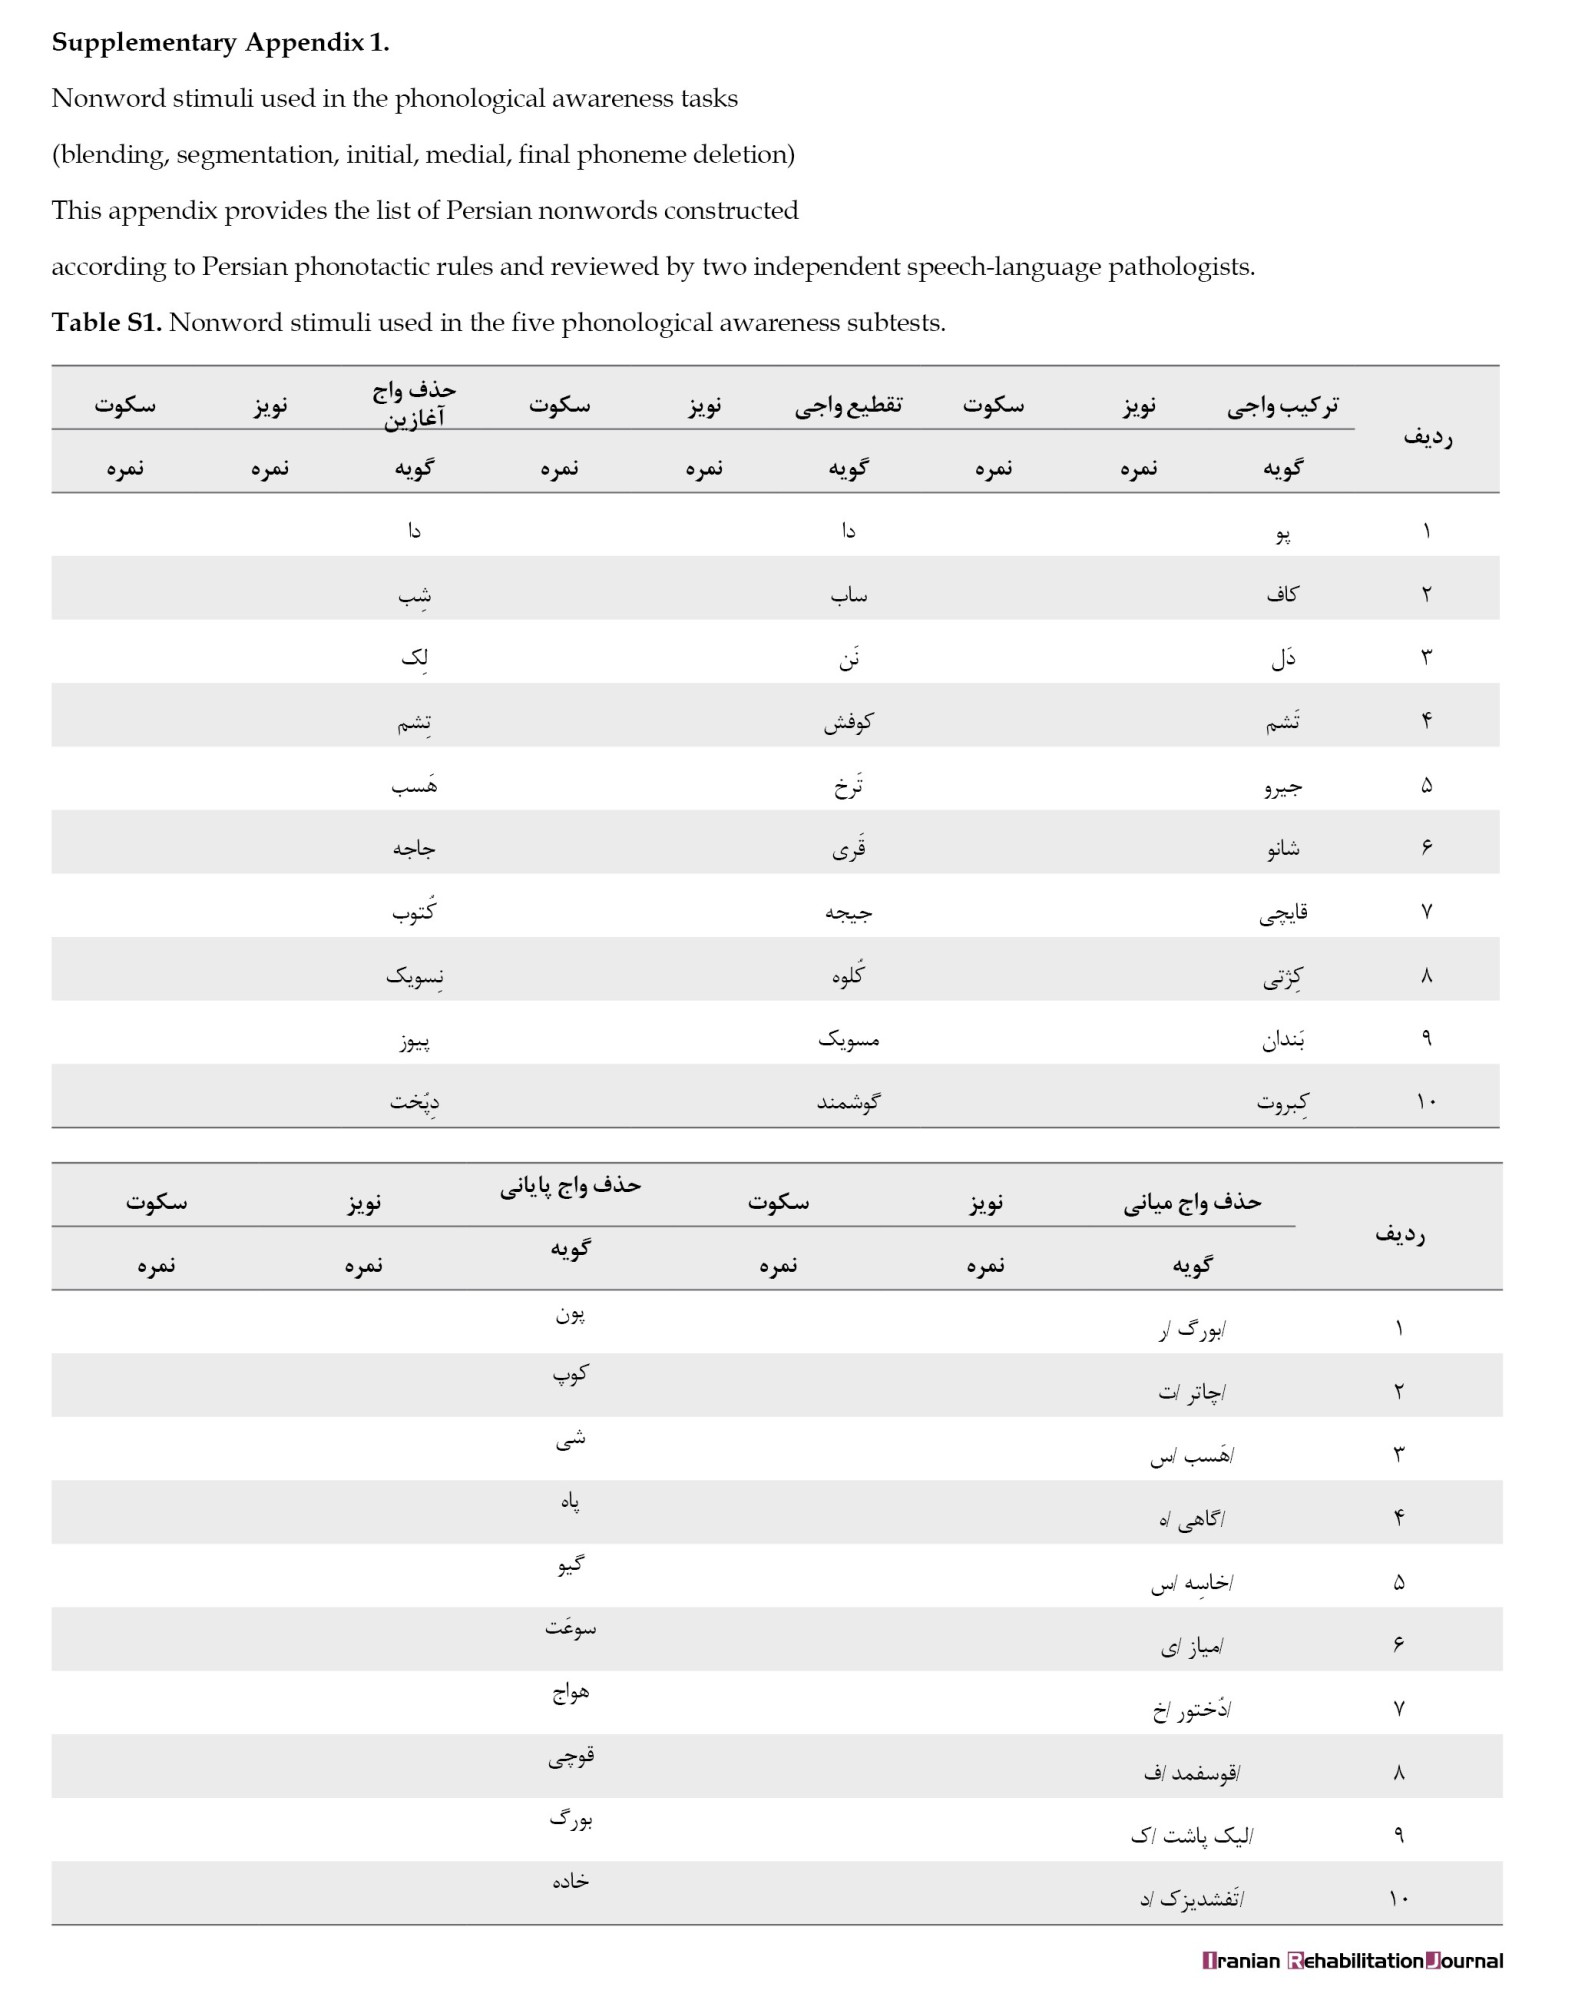
The nonwords were developed based on the Solimani-Dastjerdi test under the supervision of two speech-language pathologists who were university faculty members with more than 20 years of experience working with children with hearing loss. The items followed Persian phonotactic rules and matched the original test items in structure and complexity. Items considered inappropriate or ambiguous were revised or replaced based on the experts’ comments. The final set included 50 nonwords with CV, CVC, and CVCC structures, most of which were one or two syllables in length (Supplementary Appendix).
Scoring
Responses were scored dichotomously as 0 (incorrect) or 1 (correct). A response was considered correct when the target phoneme sequence was produced without omission, substitution, or transposition errors. Failure to respond within 10 seconds was scored as incorrect. Each item could be replayed once at the child’s request. All responses were recorded and independently rescored by a second speech-language pathologist who was blinded to group allocation. Inter-rater reliability was assessed using an intraclass correlation coefficient (ICC) based on a two-way random-effects model for absolute agreement.
Statistical analysis
Data were analyzed using SPSS software, version 27. Normality was assessed using the Shapiro–Wilk test; for quiet–noise comparisons, normality was evaluated based on the difference scores. Independent-samples t-tests, Welch’s t-tests, or Mann–Whitney U tests were used for between-group and between-grade comparisons, whereas paired-samples t-tests or Wilcoxon signed-rank tests were used for within-participant comparisons. Exact two-sided P values were reported for nonparametric tests. Holm correction was applied within each prespecified family of comparisons, with total-score comparisons corrected separately. Statistical significance was set at Holm-adjusted P<0.05. Effect sizes were reported uniformly as r. For parametric comparisons, r was calculated as Equation 1:
1. √[t²/(t² + df)],
whereas for Mann–Whitney U and Wilcoxon signed-rank tests, r was calculated as Equation 2:
2. |Z|/√N,
where N represented the total number of observations for independent-group comparisons and the number of paired observations for within-participant comparisons.
Results
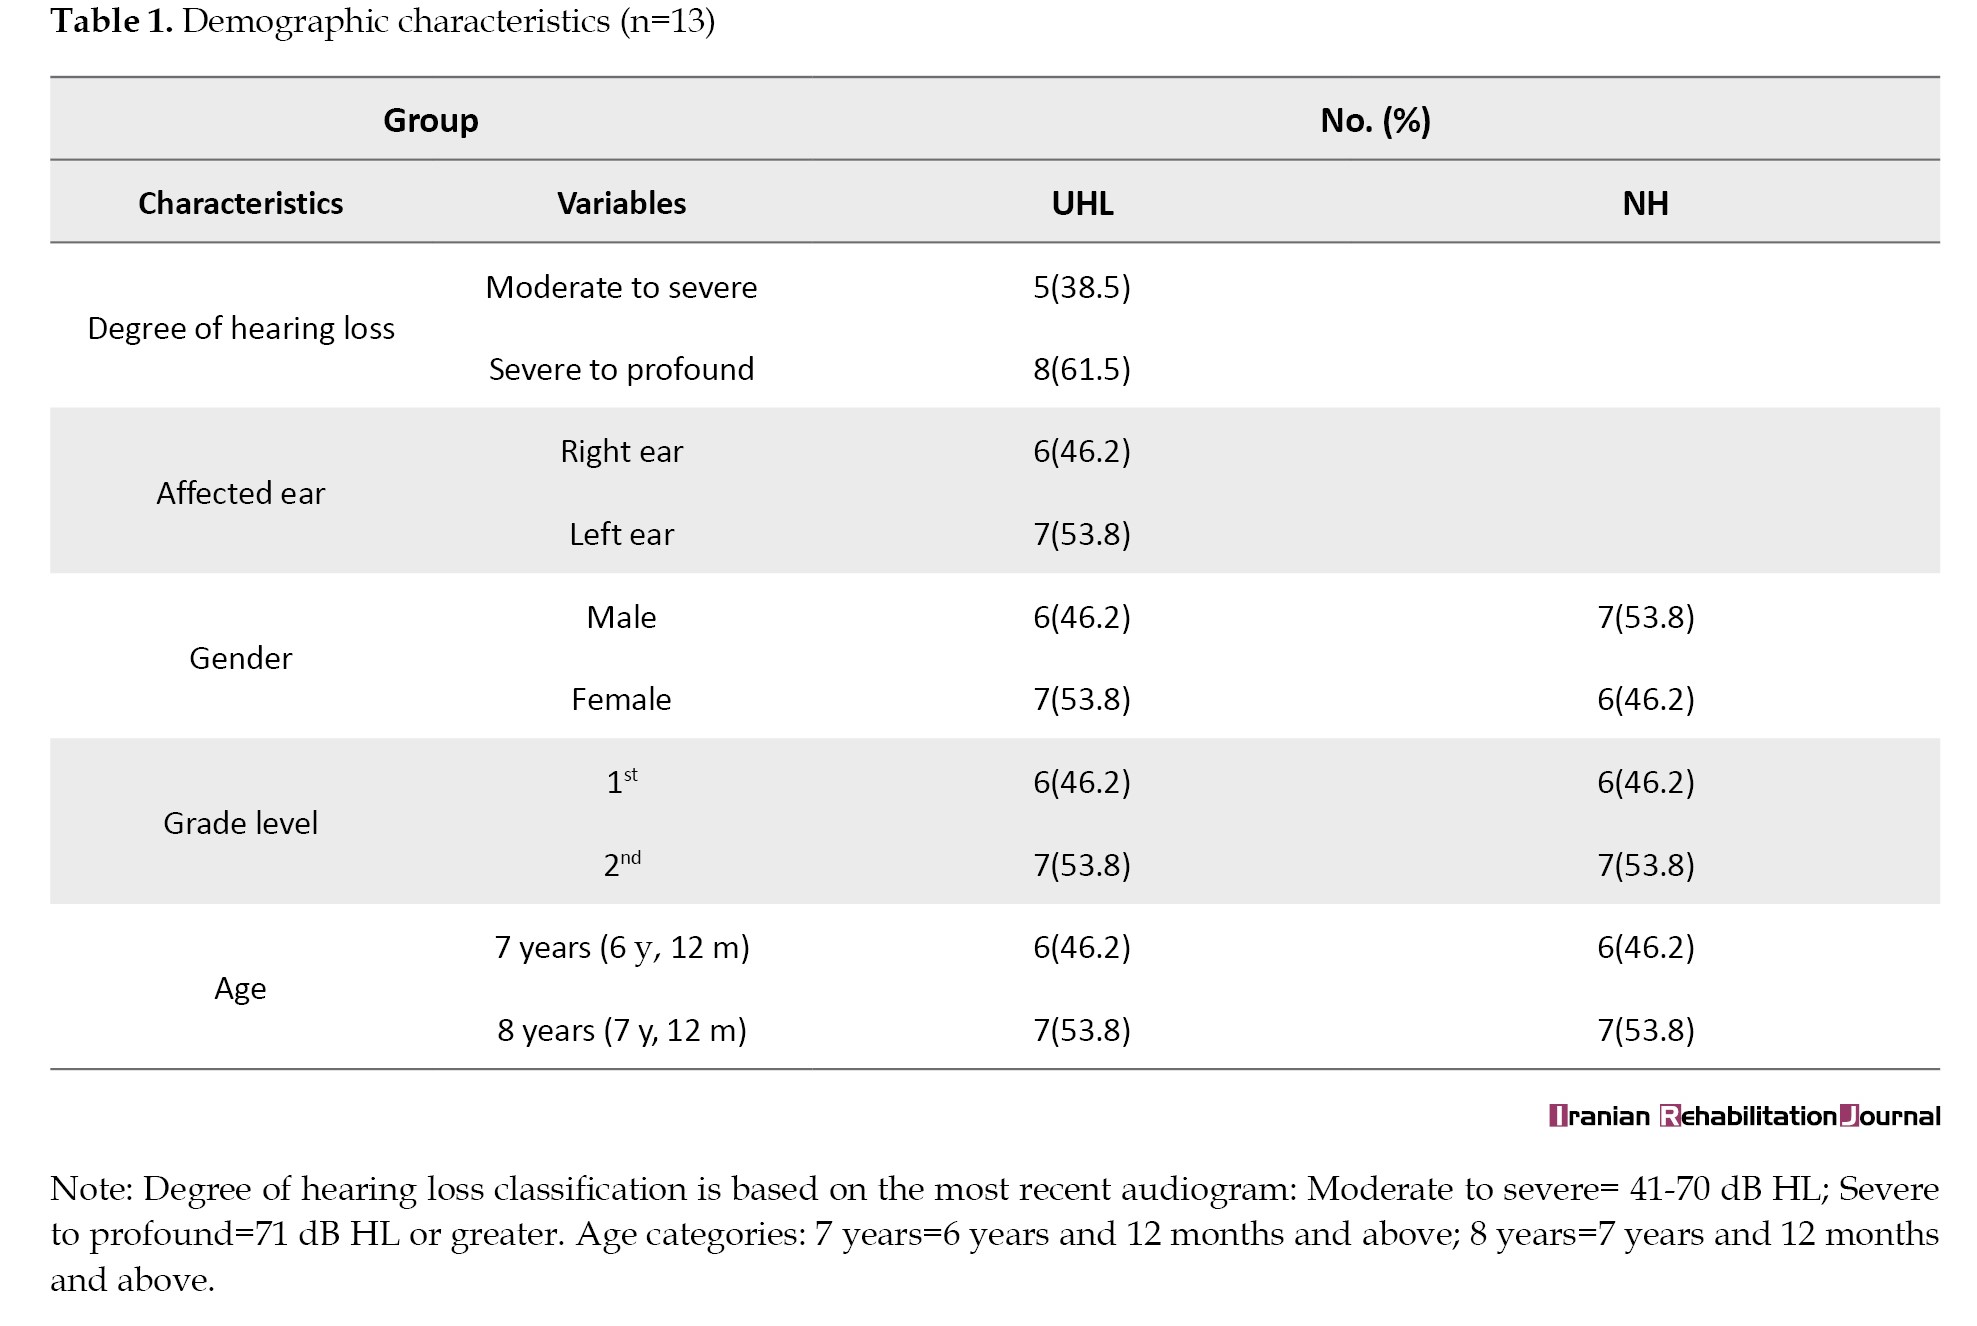
The UHL and NH groups were comparable in terms of age and grade distribution. In the UHL group, eight children (61.5%) had severe-to-profound hearing loss, and five children (38.5%) had moderate-to-severe hearing loss. The affected ear was the right ear in six children (46.2%) and the left ear in seven children (53.8%) (Table 1).
Descriptively, mean scores were generally higher in the NH group than in the UHL group across the phonological awareness subtests. Within both hearing-status groups, second-grade children generally obtained higher mean scores than first-grade children, and mean scores were higher under the quiet condition than under the noise condition. Several subtests showed near-ceiling performance in the NH group under the quiet condition, whereas the UHL group showed greater variability. Medial-phoneme deletion had the lowest mean scores in several group and condition combinations, indicating that it was descriptively one of the most difficult tasks. Mean scores were generally higher in quiet than in noise in both hearing-status groups; the corresponding within-group comparisons are reported below.
Supplementary Table S1 presents Shapiro–Wilk normality test results for all phonological awareness outcomes and quiet–noise difference scores.
Parametric or nonparametric tests were selected accordingly.
UHL vs NH comparisons by grade and listening condition
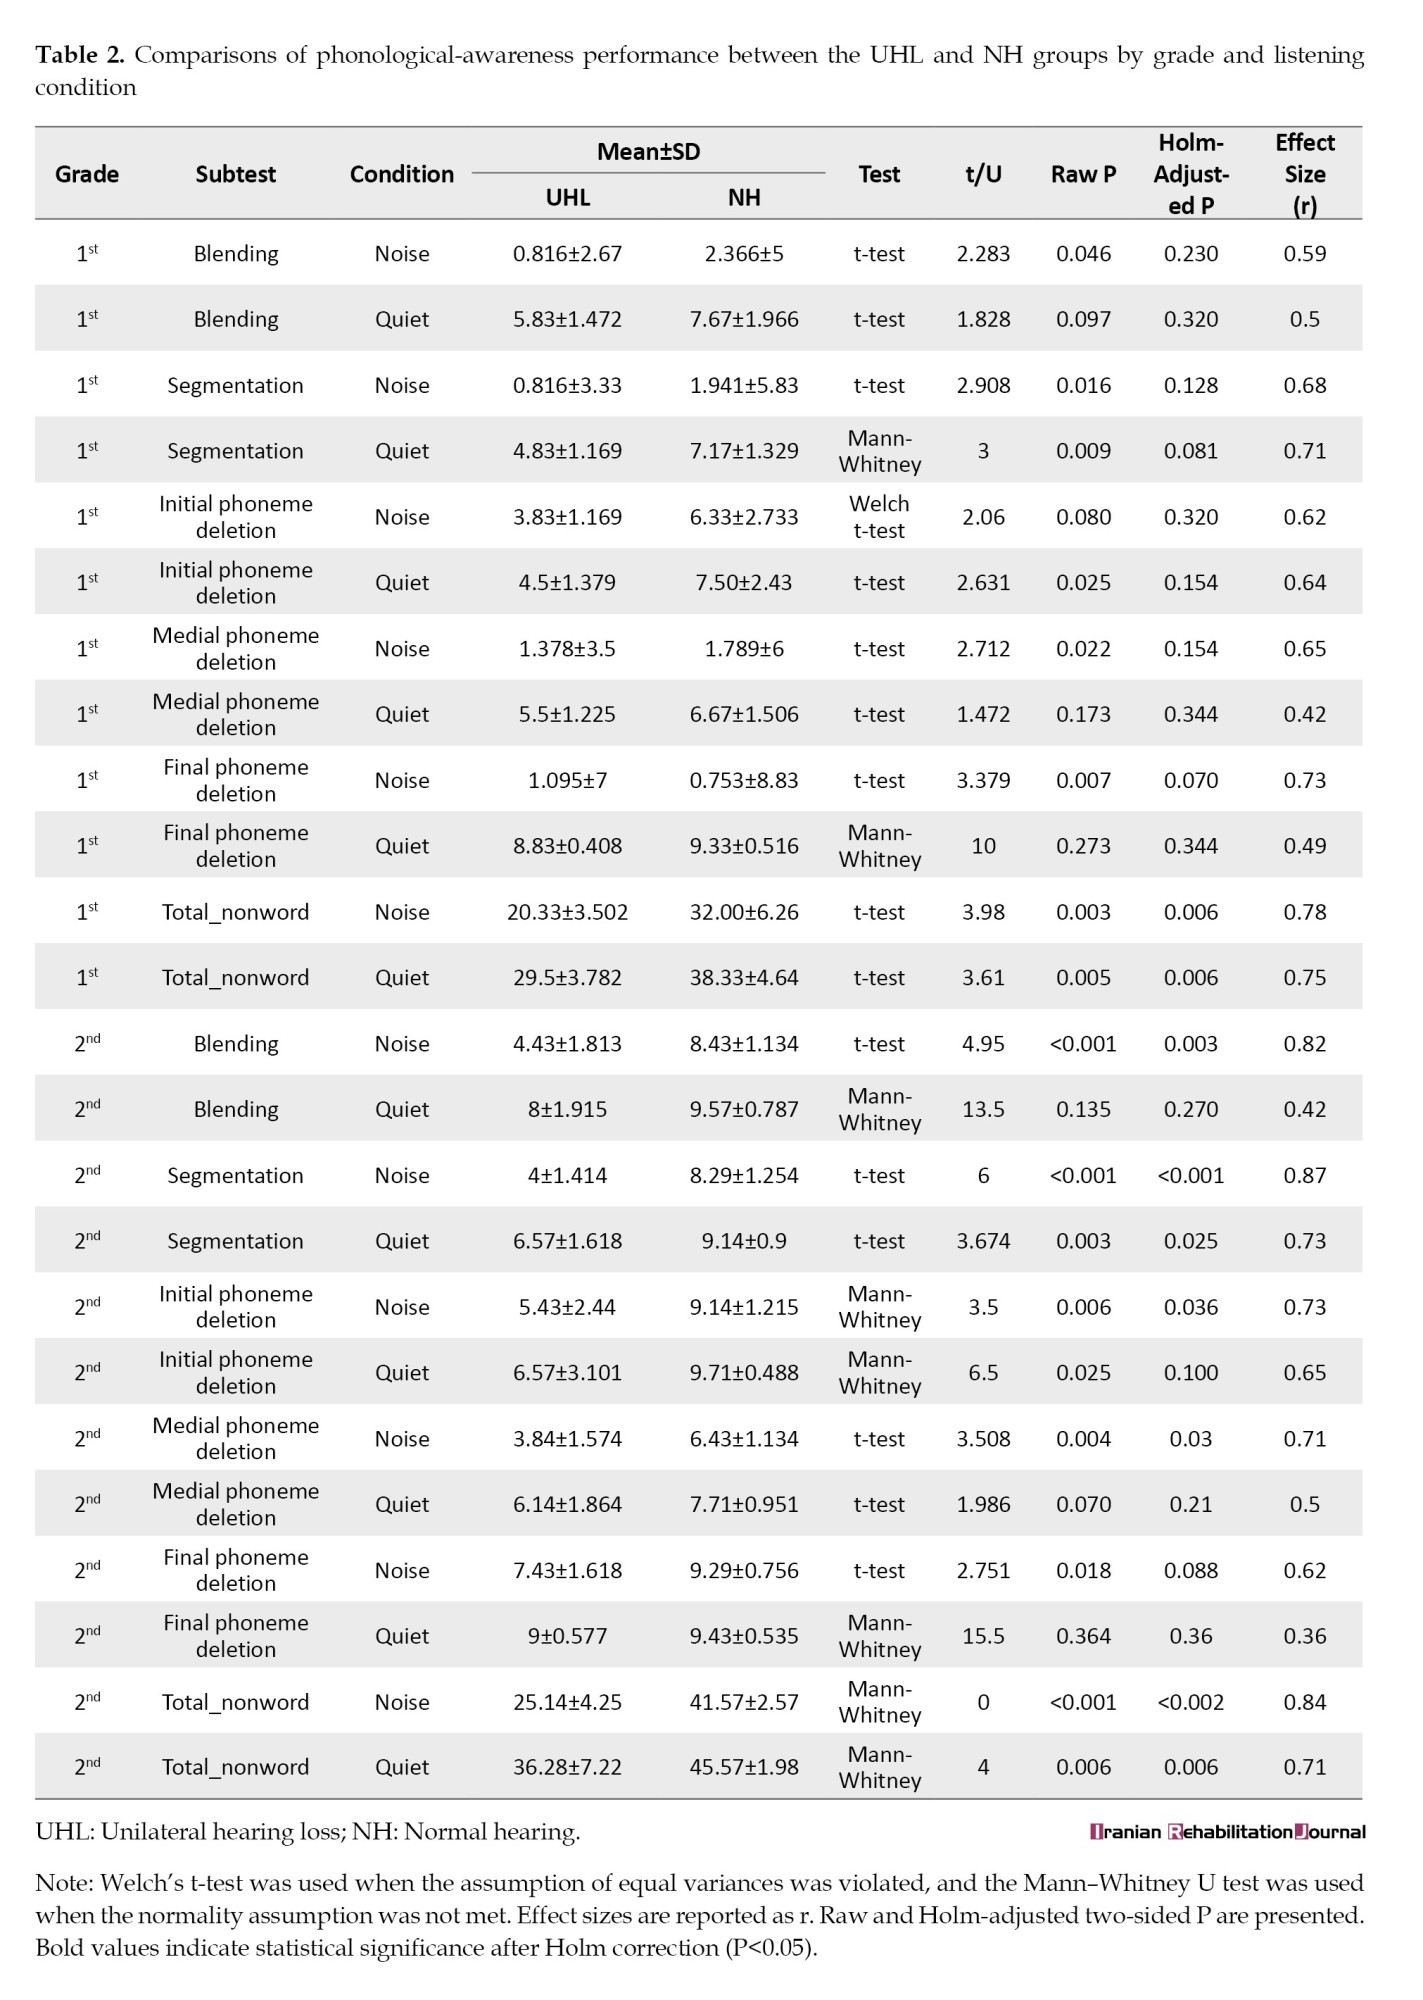
In first-grade children, segmentation and final-phoneme deletion in quiet were analyzed using Mann–Whitney U tests, initial-phoneme deletion in noise using Welch’s t-test, and the remaining subtest comparisons using independent-samples t-tests. The NH group obtained higher mean scores across all subtests. Although several raw subtest comparisons were significant, none of the ten subtest comparisons remained statistically significant after Holm correction (adjusted P=0.070–0.344; r=0.42–0.73). In contrast, total nonword scores were significantly higher in the NH group under both the noise condition (adjusted P=0.006, r=0.78) and the quiet condition (adjusted P=0.006, r=0.75).
In second-grade children, the NH group obtained higher mean scores across all subtests. After Holm correction, significant between-group differences remained for blending in noise, segmentation in both noise and quiet, initial-phoneme deletion in noise, and medial-phoneme deletion in noise (adjusted P<0.05; r=0 .71–0.87). The remaining five subtest comparisons were not statistically significant after correction. The total nonword scores were significantly higher in the NH group under both the noise condition (adjusted P<0.002, r=0.84) and quiet condition (adjusted P=0.006, r=0.71) (Table 2).
First- vs second-grade comparisons within hearing groups
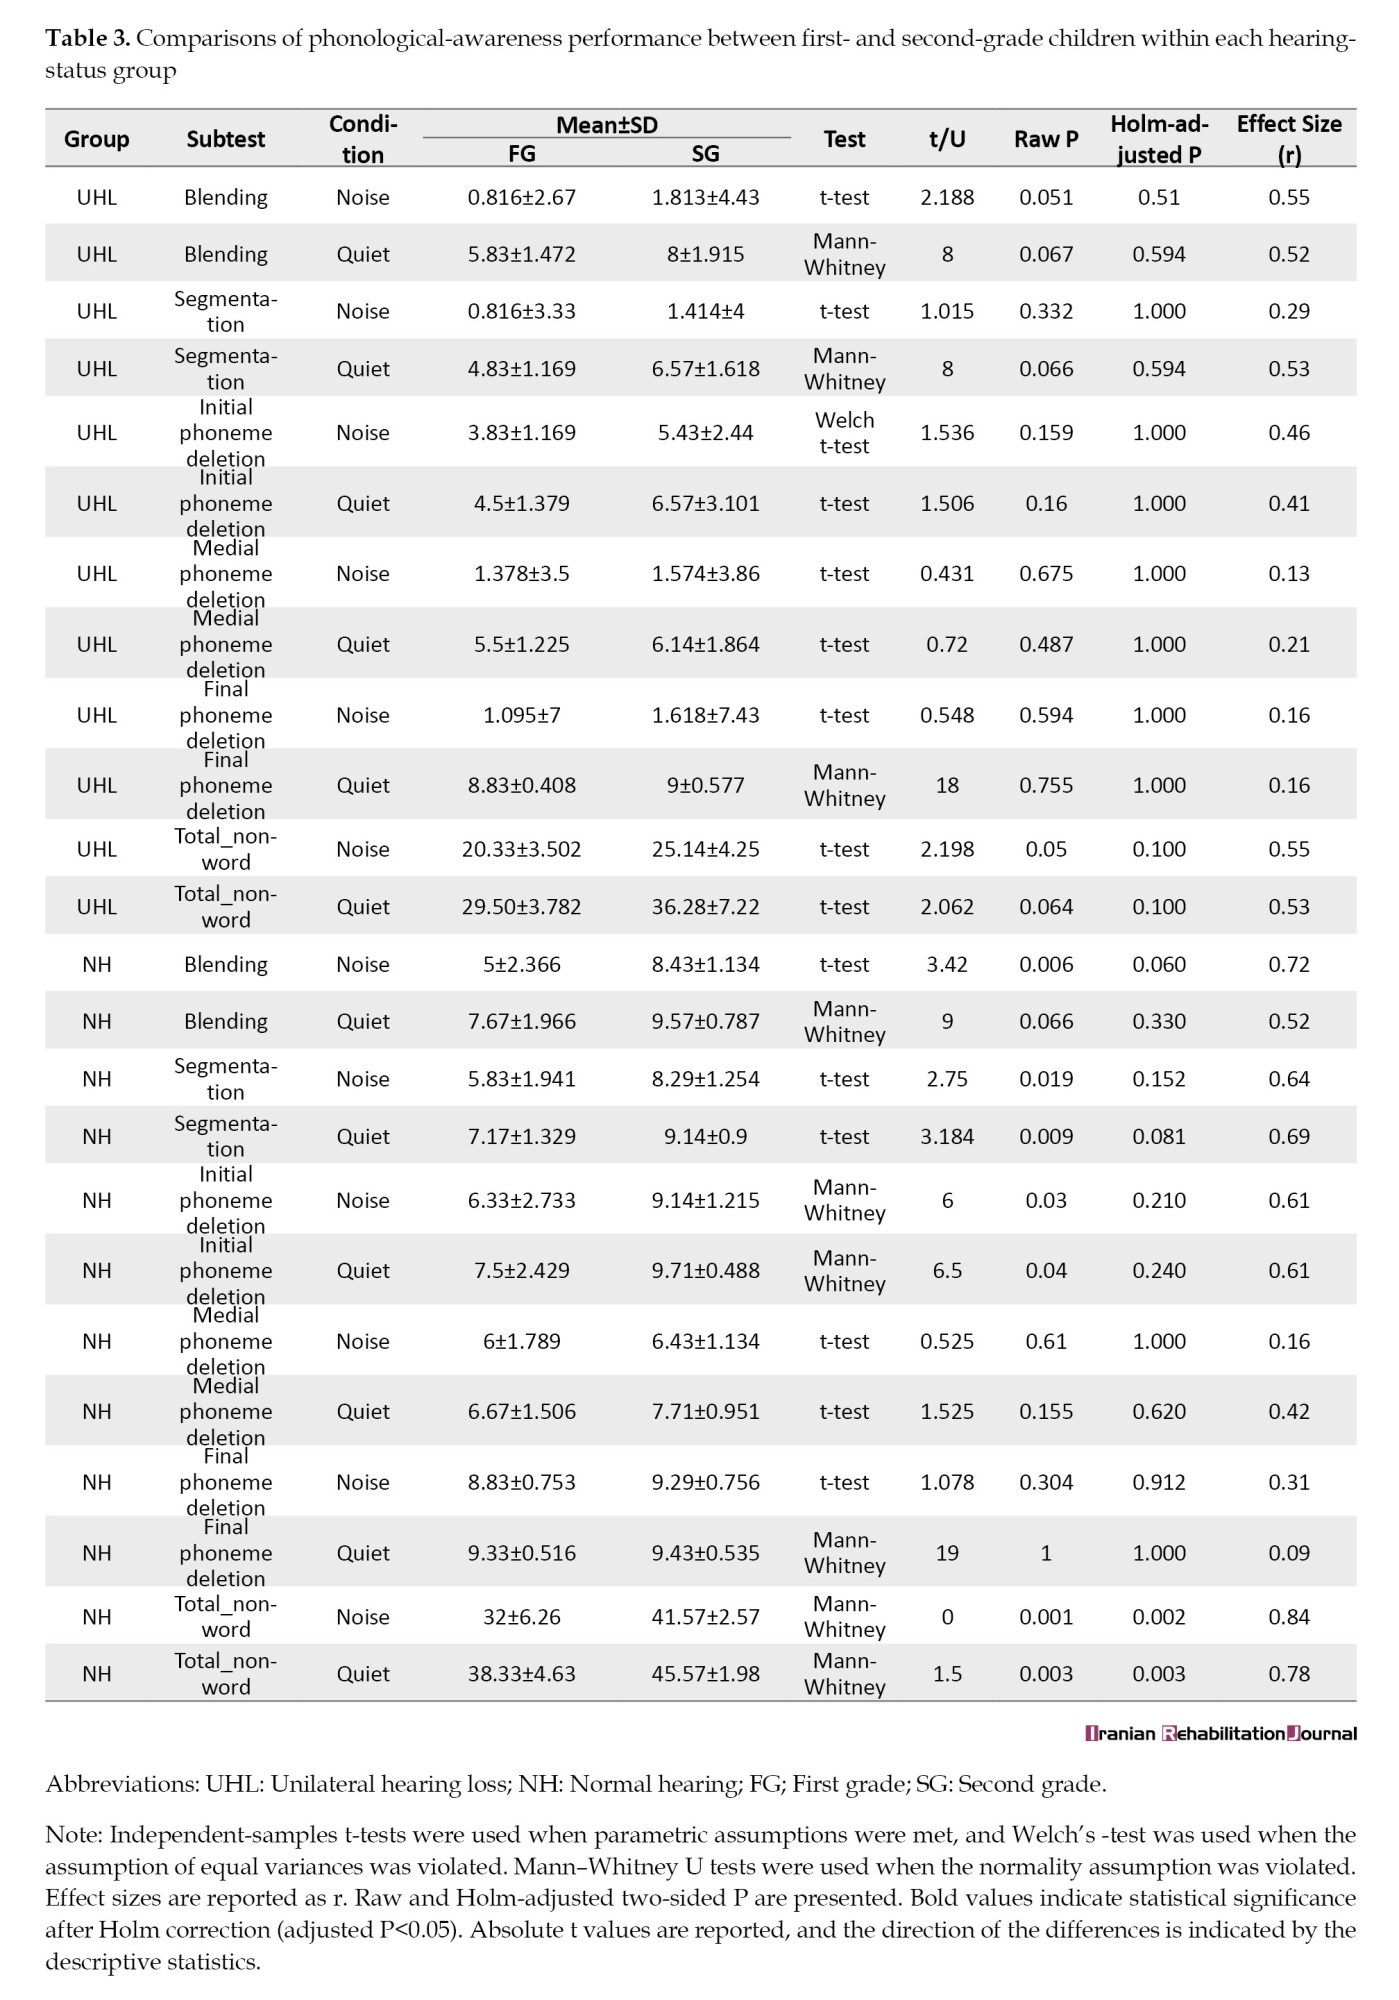
In the UHL group, no significant differences were found between first- and second-grade children across either the phonological awareness subtests or the total nonword scores after Holm correction.
In the NH group, none of the subtest-level differences between first- and second-grade children remained statistically significant after Holm correction. However, total nonword scores were significantly higher in second-grade children under both noise and quiet conditions (Holm-adjusted P=0.002 and 0.003, respectively) (Table 3).
Quiet vs noise comparisons by hearing group and grade
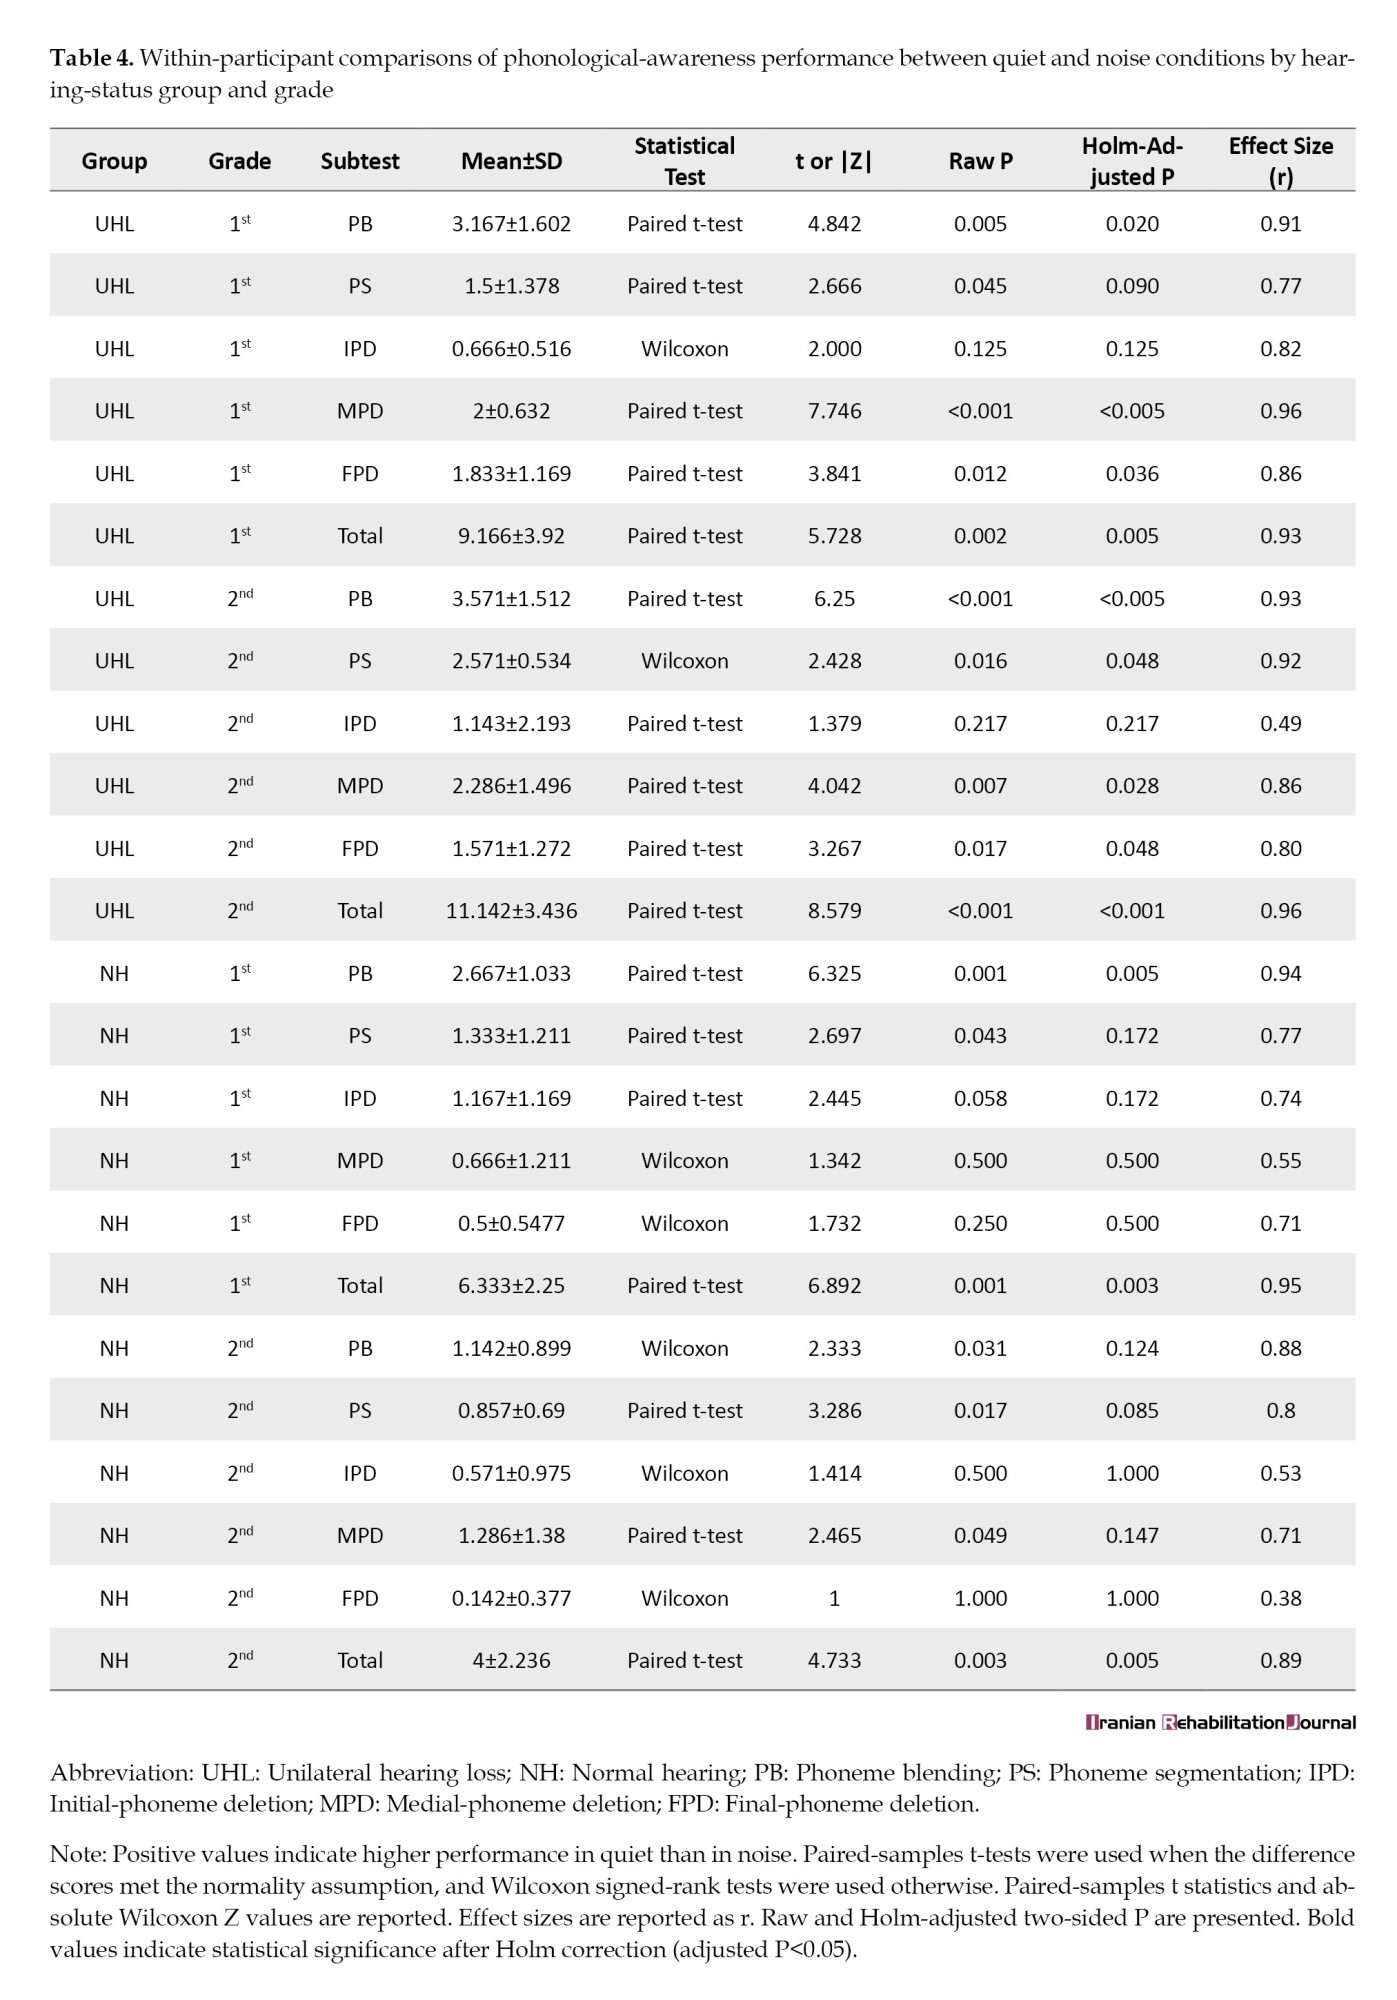
In the UHL group, first-grade children obtained significantly higher scores in quiet than in noise for blending, medial-phoneme deletion, and final-phoneme deletion after Holm correction (adjusted P=0.020, <0.005, and 0.036, respectively). Differences in segmentation and initial-phoneme deletion were not statistically significant after correction. In second-grade children, significant quiet–noise differences remained for blending, segmentation, medial-phoneme deletion, and final-phoneme deletion, with Holm-adjusted P ranging from <0.005 to 0.048, whereas initial-phoneme deletion was not significant. The significant comparisons showed large effect sizes (r=0.8–0.96).
In the NH group, first-grade children showed a significant quiet–noise difference only for blending after Holm correction (adjusted P=0.005, r=0.94). In second-grade children, none of the quiet–noise comparisons remained statistically significant after correction, although large effect sizes were observed for blending, segmentation, and medial-phoneme deletion (r=0.71–0.88).Total nonword scores were also significantly higher in quiet than in noise in both grades and hearing-status groups, with Holm-adjusted P ranging from <0.001 to 0.005 and large effect sizes (r=0.89–0.96) (Table 4).
Inter-rater reliability
To assess inter-rater scoring reliability, the test was recorded for each child, and the second rater was blinded to group allocation. The ICC was then calculated using a two-way random effects model for absolute agreement. The ICC for nonwords in noise was 0.950 (95% confidence interval [CI], 0.851%, 0.984%, P<0.001) and for nonwords in the quiet condition was 0.950 (95% CI, 0.851%, 0.984%, P<0.001). The results indicated that both ICC values were in the excellent range, demonstrating very high inter-rater reliability.
Digit span scores
The mean backward digit span score was 2.23±0.44 in the NH group and 2.15±0.38 in the UHL group. Backward digit span scores were not significantly different between the two groups (Mann–Whitney U=78, Z=−0.488, exact P=1.000, r=0.1).
Discussion
Phonological awareness is a key component of language development and depends partly on accurate auditory input. This study examined nonword-based phonological-awareness performance across tasks with different phonological demands, under quiet and noise conditions, in children with UHL and their peers with NH [1, 5, 15].
Between-group differences were task- and grade-specific. In first-grade children, the NH group obtained higher mean scores across all subtests, although none of the subtest-level differences remained statistically significant after Holm correction. In second-grade children, the NH group performed significantly better in blending in noise, segmentation in both conditions, and initial- and medial-phoneme deletion in noise. Total nonword scores were also significantly higher in the NH group under both listening conditions in both grades. These findings are consistent with previous reports of speech-perception and word-learning difficulties in children with UHL, particularly under adverse listening conditions [3, 16, 20]. Because nonword tasks reduce reliance on lexical familiarity, the observed differences may reflect difficulties in processing unfamiliar phonological information rather than lexical knowledge alone [15, 21]. Several first-grade comparisons nevertheless yielded moderate-to-large effect-size estimates; given the small subgroup sizes and nonsignificant Holm-adjusted P, these estimates should be interpreted as imprecise descriptive indicators rather than evidence of reliable group differences.
Backward digit span scores did not differ significantly between the groups, suggesting that a general difference in working-memory span did not account for the observed pattern. However, variability in hearing-loss severity and other auditory, cognitive, or linguistic factors may have contributed to individual differences [12, 13]. Performance also varied across tasks. Medial-phoneme deletion produced the lowest mean scores in several group and condition combinations and was descriptively among the most difficult tasks. Among second-grade children, initial- and medial-phoneme deletion in noise differentiated the UHL and NH groups, whereas final-phoneme deletion did not remain significant after correction. Thus, hearing status and listening condition were not associated with a uniform pattern across phonological-awareness tasks [11].
At the subtest level, significant quiet–noise differences were more frequent in the UHL group. First-grade children with UHL performed significantly better in quiet for blending and medial- and final-phoneme deletion, whereas second-grade children with UHL showed significant differences for blending, segmentation, and medial- and final-phoneme deletion. In the NH group, only blending remained significant in first-grade children, and no subtest-level comparison remained significant in second-grade children. Total nonword scores, however, were significantly higher in quiet than in noise in both grades and both hearing-status groups. Nevertheless, because the listening-condition order was fixed and a direct group-by-condition interaction was not tested, the present findings do not establish that noise affected the UHL group significantly more than the NH group. No subtest-level difference between first- and second-grade children remained significant within either hearing-status group; only total nonword scores in the NH group were significantly higher in second-grade children under both listening conditions. These cross-sectional findings should therefore not be interpreted as evidence of developmental change over time [7, 8, 19].
Clinically, the findings support assessing phonological awareness using multiple tasks under both quiet and noise conditions, because performance differences were not uniform across subtests. Educational planning may also benefit from explicit phonological-awareness support and reduced background noise in classroom environments [23]. The main limitations were the small grade-specific samples, variability in hearing-loss severity, the fixed noise-first test order, the cross-sectional design, and the exclusion of children using hearing aids, which limits generalizability to aided children with UHL. Future studies should include larger and more homogeneous samples, counterbalance listening-condition order, directly examine group-by-condition interactions, and further investigate auditory, cognitive, and linguistic contributions to phonological processing [13, 14].
Conclusion
The findings indicate that nonword-based phonological-awareness performance in children with UHL differs according to task demands, grade, and listening condition. At the subtest level, between-group differences were concentrated in second-grade children and were particularly evident for tasks presented in noise; no first-grade subtest-level comparison remained significant after Holm correction. However, total nonword scores were significantly higher in the NH group under both listening conditions in both grades. Quiet–noise differences were more frequent in the UHL group at the subtest level, whereas total scores were significantly higher in quiet across all four grade-by-hearing-status subgroups. Because the test order was fixed and no direct group-by-condition interaction was examined, these findings require cautious interpretation. Overall, the results support using varied phonological-awareness tasks under different listening conditions and highlight the importance of improving auditory access in educational and clinical settings.
Ethical Considerations
Compliance with ethical guidelines
this study was approved by the Research Ethics Committee of the University of Social Welfare and Rehabilitation Sciences, Tehran, Iran (Code: IR.USWR.REC.1403.119). Informed consent was obtained from all participants.
Funding
This research did not receive any specific grant from funding agencies in the public, commercial, or not-for-profit sectors.
Authors' contributions
Conceptualization: Tarane Kazemi, Akbar Darouie, Talieh Zarifian and Mohsen Ahadi; Methodology: Akbar Darouie and Mohsen Vahedi; Investigation: Tarane Kazemi, Akbar Darouie and Talieh Zarifian; Writing the original draft: Tarane Kazemi; Review and editing: Akbar Darouie and Talieh Zarifian; Resources and supervision: Akbar Darouie, Talieh Zarifian and Mohsen Ahadi.
Conflict of interest
The authors declared no conflict of interest.
Acknowledgments
The authors thank Nasrin Yazdani, Parvaneh Mahdi, the parents of the children, school principals, colleagues including Zeinab Barati and Arsham Neshati, and all individuals who assisted in the implementation and sampling process.
Hearing is a fundamental sensory modality that supports the development of speech, language, and academic skills. Auditory processing involves receiving acoustic signals in the peripheral auditory system and encoding them in central auditory pathways [1, 2]. Binaural hearing enhances speech perception, particularly in noisy environments, through mechanisms, such as binaural summation, the head shadow effect, and release from masking [3].
Unilateral hearing loss (UHL), defined as normal hearing (≤15 dB HL) in one ear and sensorineural hearing loss in the contralateral ear, reduces the benefits of binaural processing [4, 5]. Although one normal-hearing ear was previously considered sufficient for typical development, evidence indicates that children with UHL are at risk for delays in speech and language development, as well as deficits in auditory processing and academic performance [6–8]. Children with UHL also demonstrate poorer performance in speech perception in noise, temporal auditory processing, and phonological and language-related tasks [4, 9, 10].
Phonological awareness is a core skill underlying language development and early reading acquisition and depends on precise and stable auditory input [11]. Disruptions in auditory input, especially under noisy conditions, may impair the formation of stable phonological representations and increase reliance on cognitive resources such as working memory [12, 13]. Children with UHL have demonstrated difficulties in temporal auditory processing [4, 10], and temporal-processing limitations may negatively affect phonological awareness skills, including phoneme identification and manipulation [14].
Nonword-based tasks are sensitive measures of phonological processing because they require the encoding, temporary storage, and manipulation of novel sound sequences with minimal support from lexical knowledge [15]. Previous studies have also reported poorer speech perception in noise in children with UHL [16, 17], as well as difficulties in phonological, vocabulary, and broader language outcomes [18, 19]. One study further showed that children with UHL had greater difficulty with novel-word learning, particularly under noisy listening conditions [20]. However, it remains unclear which levels of phonological manipulation are most affected.
Accordingly, the present study aimed to compare different phonological manipulation subskills across listening conditions and grade levels in children with UHL and their normal-hearing peers.
Materials and Methods
Study design and participants
This comparative cross-sectional study included 26 Persian-speaking first- and second-grade children aged 6-8 years in Tehran, Iran. Participants were divided into two hearing-status groups: children with UHL (n=13) and normal-hearing peers (NH; n=13). Each participant completed five nonword-based phonological awareness subtests under both noise and quiet listening conditions. Analyses were conducted at three levels: 1) comparisons between the UHL and NH groups within each grade and listening condition; 2) comparisons between first- and second-grade children within each hearing-status group and listening condition; and 3) within-participant comparisons between noise and quiet conditions within each grade and hearing-status group.
Sample size estimation
Sample size was calculated using G*Power software, version 3.1, assuming an effect size of d=0.8, α=0.05, and power=0.8. The minimum required sample size was 13 participants per hearing-status group, for a total of 26 participants.
Inclusion and exclusion criteria
Participants were Persian-speaking children with congenital or early-acquired unilateral sensorineural hearing loss before age 2. Children in the UHL group had hearing thresholds greater than 41 dB HL in the affected ear and ≤15 dB HL in the contralateral ear. Children who used hearing aids were excluded to reduce heterogeneity associated with amplification history, device fitting, duration and consistency of use, and aided audibility. Other exclusion criteria included neurological disorders, autism spectrum disorder, attention-deficit/hyperactivity disorder, intellectual disability, and visual impairment. Participants with a backward digit span of two digits or greater were eligible for inclusion, whereas those with a span below two digits were excluded. The NH group met the same eligibility criteria but had bilateral hearing thresholds ≤15 dB HL.
Procedures
After obtaining ethical approval and written parental consent, demographic, medical, and audiological information was collected. The Backward Digit Span test was administered before the phonological awareness assessment. Testing was conducted in a 12 m² classroom-like room. The quiet condition was not treated as a baseline. The fixed order was selected to prevent task-related fatigue from disproportionately affecting performance under the more demanding noise condition. However, because the order was not counterbalanced, possible practice, stimulus-familiarity, and order effects cannot be excluded. Therefore, comparisons between noise and quiet conditions should be interpreted cautiously.
In the noise condition, standardized Persian eight-talker babble noise was presented from the two lateral loudspeakers, while the test stimuli were presented from the front loudspeaker. Speech and noise were presented at 65 dB SPL and 60 dB SPL, respectively, resulting in a signal-to-noise ratio of +5 dB [16, 17, 21]. Three loudspeakers were positioned at 0°, +90°, and −90° relative to the child [16]. The distance between the child and each loudspeaker was 1 meter, and the loudspeakers were positioned at ear level. Sound levels were calibrated using a Type 1 sound level meter [22]. In the quiet condition, only the front loudspeaker was active, and ambient noise was maintained below 40 dB [23]. All test stimuli were pre-recorded to control for visual and intensity-related cues. The total testing time was approximately 45–60 minutes.
Nonword development
The nonwords were developed based on the Solimani-Dastjerdi test under the supervision of two speech-language pathologists who were university faculty members with more than 20 years of experience working with children with hearing loss. The items followed Persian phonotactic rules and matched the original test items in structure and complexity. Items considered inappropriate or ambiguous were revised or replaced based on the experts’ comments. The final set included 50 nonwords with CV, CVC, and CVCC structures, most of which were one or two syllables in length (Supplementary Appendix).
Scoring
Responses were scored dichotomously as 0 (incorrect) or 1 (correct). A response was considered correct when the target phoneme sequence was produced without omission, substitution, or transposition errors. Failure to respond within 10 seconds was scored as incorrect. Each item could be replayed once at the child’s request. All responses were recorded and independently rescored by a second speech-language pathologist who was blinded to group allocation. Inter-rater reliability was assessed using an intraclass correlation coefficient (ICC) based on a two-way random-effects model for absolute agreement.
Statistical analysis
Data were analyzed using SPSS software, version 27. Normality was assessed using the Shapiro–Wilk test; for quiet–noise comparisons, normality was evaluated based on the difference scores. Independent-samples t-tests, Welch’s t-tests, or Mann–Whitney U tests were used for between-group and between-grade comparisons, whereas paired-samples t-tests or Wilcoxon signed-rank tests were used for within-participant comparisons. Exact two-sided P values were reported for nonparametric tests. Holm correction was applied within each prespecified family of comparisons, with total-score comparisons corrected separately. Statistical significance was set at Holm-adjusted P<0.05. Effect sizes were reported uniformly as r. For parametric comparisons, r was calculated as Equation 1:
1. √[t²/(t² + df)],
whereas for Mann–Whitney U and Wilcoxon signed-rank tests, r was calculated as Equation 2:
2. |Z|/√N,
where N represented the total number of observations for independent-group comparisons and the number of paired observations for within-participant comparisons.
Results
The UHL and NH groups were comparable in terms of age and grade distribution. In the UHL group, eight children (61.5%) had severe-to-profound hearing loss, and five children (38.5%) had moderate-to-severe hearing loss. The affected ear was the right ear in six children (46.2%) and the left ear in seven children (53.8%) (Table 1).
Descriptively, mean scores were generally higher in the NH group than in the UHL group across the phonological awareness subtests. Within both hearing-status groups, second-grade children generally obtained higher mean scores than first-grade children, and mean scores were higher under the quiet condition than under the noise condition. Several subtests showed near-ceiling performance in the NH group under the quiet condition, whereas the UHL group showed greater variability. Medial-phoneme deletion had the lowest mean scores in several group and condition combinations, indicating that it was descriptively one of the most difficult tasks. Mean scores were generally higher in quiet than in noise in both hearing-status groups; the corresponding within-group comparisons are reported below.
Supplementary Table S1 presents Shapiro–Wilk normality test results for all phonological awareness outcomes and quiet–noise difference scores.
Parametric or nonparametric tests were selected accordingly.
UHL vs NH comparisons by grade and listening condition
In first-grade children, segmentation and final-phoneme deletion in quiet were analyzed using Mann–Whitney U tests, initial-phoneme deletion in noise using Welch’s t-test, and the remaining subtest comparisons using independent-samples t-tests. The NH group obtained higher mean scores across all subtests. Although several raw subtest comparisons were significant, none of the ten subtest comparisons remained statistically significant after Holm correction (adjusted P=0.070–0.344; r=0.42–0.73). In contrast, total nonword scores were significantly higher in the NH group under both the noise condition (adjusted P=0.006, r=0.78) and the quiet condition (adjusted P=0.006, r=0.75).
In second-grade children, the NH group obtained higher mean scores across all subtests. After Holm correction, significant between-group differences remained for blending in noise, segmentation in both noise and quiet, initial-phoneme deletion in noise, and medial-phoneme deletion in noise (adjusted P<0.05; r=0 .71–0.87). The remaining five subtest comparisons were not statistically significant after correction. The total nonword scores were significantly higher in the NH group under both the noise condition (adjusted P<0.002, r=0.84) and quiet condition (adjusted P=0.006, r=0.71) (Table 2).
First- vs second-grade comparisons within hearing groups
In the UHL group, no significant differences were found between first- and second-grade children across either the phonological awareness subtests or the total nonword scores after Holm correction.
In the NH group, none of the subtest-level differences between first- and second-grade children remained statistically significant after Holm correction. However, total nonword scores were significantly higher in second-grade children under both noise and quiet conditions (Holm-adjusted P=0.002 and 0.003, respectively) (Table 3).
Quiet vs noise comparisons by hearing group and grade
In the UHL group, first-grade children obtained significantly higher scores in quiet than in noise for blending, medial-phoneme deletion, and final-phoneme deletion after Holm correction (adjusted P=0.020, <0.005, and 0.036, respectively). Differences in segmentation and initial-phoneme deletion were not statistically significant after correction. In second-grade children, significant quiet–noise differences remained for blending, segmentation, medial-phoneme deletion, and final-phoneme deletion, with Holm-adjusted P ranging from <0.005 to 0.048, whereas initial-phoneme deletion was not significant. The significant comparisons showed large effect sizes (r=0.8–0.96).
In the NH group, first-grade children showed a significant quiet–noise difference only for blending after Holm correction (adjusted P=0.005, r=0.94). In second-grade children, none of the quiet–noise comparisons remained statistically significant after correction, although large effect sizes were observed for blending, segmentation, and medial-phoneme deletion (r=0.71–0.88).Total nonword scores were also significantly higher in quiet than in noise in both grades and hearing-status groups, with Holm-adjusted P ranging from <0.001 to 0.005 and large effect sizes (r=0.89–0.96) (Table 4).
Inter-rater reliability
To assess inter-rater scoring reliability, the test was recorded for each child, and the second rater was blinded to group allocation. The ICC was then calculated using a two-way random effects model for absolute agreement. The ICC for nonwords in noise was 0.950 (95% confidence interval [CI], 0.851%, 0.984%, P<0.001) and for nonwords in the quiet condition was 0.950 (95% CI, 0.851%, 0.984%, P<0.001). The results indicated that both ICC values were in the excellent range, demonstrating very high inter-rater reliability.
Digit span scores
The mean backward digit span score was 2.23±0.44 in the NH group and 2.15±0.38 in the UHL group. Backward digit span scores were not significantly different between the two groups (Mann–Whitney U=78, Z=−0.488, exact P=1.000, r=0.1).
Discussion
Phonological awareness is a key component of language development and depends partly on accurate auditory input. This study examined nonword-based phonological-awareness performance across tasks with different phonological demands, under quiet and noise conditions, in children with UHL and their peers with NH [1, 5, 15].
Between-group differences were task- and grade-specific. In first-grade children, the NH group obtained higher mean scores across all subtests, although none of the subtest-level differences remained statistically significant after Holm correction. In second-grade children, the NH group performed significantly better in blending in noise, segmentation in both conditions, and initial- and medial-phoneme deletion in noise. Total nonword scores were also significantly higher in the NH group under both listening conditions in both grades. These findings are consistent with previous reports of speech-perception and word-learning difficulties in children with UHL, particularly under adverse listening conditions [3, 16, 20]. Because nonword tasks reduce reliance on lexical familiarity, the observed differences may reflect difficulties in processing unfamiliar phonological information rather than lexical knowledge alone [15, 21]. Several first-grade comparisons nevertheless yielded moderate-to-large effect-size estimates; given the small subgroup sizes and nonsignificant Holm-adjusted P, these estimates should be interpreted as imprecise descriptive indicators rather than evidence of reliable group differences.
Backward digit span scores did not differ significantly between the groups, suggesting that a general difference in working-memory span did not account for the observed pattern. However, variability in hearing-loss severity and other auditory, cognitive, or linguistic factors may have contributed to individual differences [12, 13]. Performance also varied across tasks. Medial-phoneme deletion produced the lowest mean scores in several group and condition combinations and was descriptively among the most difficult tasks. Among second-grade children, initial- and medial-phoneme deletion in noise differentiated the UHL and NH groups, whereas final-phoneme deletion did not remain significant after correction. Thus, hearing status and listening condition were not associated with a uniform pattern across phonological-awareness tasks [11].
At the subtest level, significant quiet–noise differences were more frequent in the UHL group. First-grade children with UHL performed significantly better in quiet for blending and medial- and final-phoneme deletion, whereas second-grade children with UHL showed significant differences for blending, segmentation, and medial- and final-phoneme deletion. In the NH group, only blending remained significant in first-grade children, and no subtest-level comparison remained significant in second-grade children. Total nonword scores, however, were significantly higher in quiet than in noise in both grades and both hearing-status groups. Nevertheless, because the listening-condition order was fixed and a direct group-by-condition interaction was not tested, the present findings do not establish that noise affected the UHL group significantly more than the NH group. No subtest-level difference between first- and second-grade children remained significant within either hearing-status group; only total nonword scores in the NH group were significantly higher in second-grade children under both listening conditions. These cross-sectional findings should therefore not be interpreted as evidence of developmental change over time [7, 8, 19].
Clinically, the findings support assessing phonological awareness using multiple tasks under both quiet and noise conditions, because performance differences were not uniform across subtests. Educational planning may also benefit from explicit phonological-awareness support and reduced background noise in classroom environments [23]. The main limitations were the small grade-specific samples, variability in hearing-loss severity, the fixed noise-first test order, the cross-sectional design, and the exclusion of children using hearing aids, which limits generalizability to aided children with UHL. Future studies should include larger and more homogeneous samples, counterbalance listening-condition order, directly examine group-by-condition interactions, and further investigate auditory, cognitive, and linguistic contributions to phonological processing [13, 14].
Conclusion
The findings indicate that nonword-based phonological-awareness performance in children with UHL differs according to task demands, grade, and listening condition. At the subtest level, between-group differences were concentrated in second-grade children and were particularly evident for tasks presented in noise; no first-grade subtest-level comparison remained significant after Holm correction. However, total nonword scores were significantly higher in the NH group under both listening conditions in both grades. Quiet–noise differences were more frequent in the UHL group at the subtest level, whereas total scores were significantly higher in quiet across all four grade-by-hearing-status subgroups. Because the test order was fixed and no direct group-by-condition interaction was examined, these findings require cautious interpretation. Overall, the results support using varied phonological-awareness tasks under different listening conditions and highlight the importance of improving auditory access in educational and clinical settings.
Ethical Considerations
Compliance with ethical guidelines
this study was approved by the Research Ethics Committee of the University of Social Welfare and Rehabilitation Sciences, Tehran, Iran (Code: IR.USWR.REC.1403.119). Informed consent was obtained from all participants.
Funding
This research did not receive any specific grant from funding agencies in the public, commercial, or not-for-profit sectors.
Authors' contributions
Conceptualization: Tarane Kazemi, Akbar Darouie, Talieh Zarifian and Mohsen Ahadi; Methodology: Akbar Darouie and Mohsen Vahedi; Investigation: Tarane Kazemi, Akbar Darouie and Talieh Zarifian; Writing the original draft: Tarane Kazemi; Review and editing: Akbar Darouie and Talieh Zarifian; Resources and supervision: Akbar Darouie, Talieh Zarifian and Mohsen Ahadi.
Conflict of interest
The authors declared no conflict of interest.
Acknowledgments
The authors thank Nasrin Yazdani, Parvaneh Mahdi, the parents of the children, school principals, colleagues including Zeinab Barati and Arsham Neshati, and all individuals who assisted in the implementation and sampling process.
References
- Anthony JL, Francis DJ. Development of phonological awareness. Current Directions in Psychological Science. 2005; 14(5):255-9. [DOI:10.1111/j.0963-7214.2005.00376.x]
- McCreery RW, Stelmachowicz PG. The effects of limited bandwidth and noise on verbal processing time and word recall in normal-hearing children. Ear and Hearing. 2013; 34(5):585. [DOI:10.1097/AUD.0b013e31828576e2] [PMID] [PMCID]
- Mondelli MF, Santos MD, José MR. Speech perception in noise in unilateral hearing loss. Brazilian Journal of Otorhinolaryngology. 2016; 82(04):427-32. [DOI:10.1016/j.bjorl.2015.08.019] [PMID] [PMCID]
- Gürses E, Türkyılmaz MD, Kalaycıoğlu C, Karabulut E, Bajin MD, Sennaroğlu L, et al. Evaluation of temporal and suprasegmental auditory processing in patients with unilateral hearing loss. Auris Nasus Larynx. 2020; 47(5):785-92.[DOI:10.1016/j.anl.2020.04.009] [PMID]
- Cole EB, Flexer C. Children with hearing loss: Developing listening and talking, birth to six. 4th ed. San Diego (CA): Plural Publishing; 2019. [Link]
- Lieu JE, Karzon RK, Ead B, Tye-Murray N. Do audiologic characteristics predict outcomes in children with unilateral hearing loss? Otology & Neurotology. 2013; 34(9):1703. [DOI:10.1097/MAO.0000000000000190] [PMID] [PMCID]
- Lieu JE. Speech-language and educational consequences of unilateral hearing loss in children. Archives of Otolaryngology–Head & Neck Surgery. 2004; 130(5):524-30. [DOI:10.1001/archotol.130.5.524] [PMID]
- Bess FH, Tharpe AM. Unilateral hearing impairment in children. Pediatrics. 1984; 74(2):206-16. [DOI:10.1542/peds.74.2.206] [PMID]
- Khorshidi M, Rouhbakhsh N, Fatahi F, Yazdani N, Yaseri M, Aarabi S. The effect of a words-in-noise training method on speech perception in noise of children with unilateral hearing loss. Auditory and Vestibular Research. 2023; 32(3):228-36. [DOI:10.18502/avr.v32i3.12939]
- Mishra SK, Dey R, Davessar JL. Temporal resolution of the normal ear in listeners with unilateral hearing impairment. Journal of the Association for Research in Otolaryngology. 2015; 16(6):773-82. [DOI:10.1007/s10162-015-0536-6] [PMID] [PMCID]
- Bernthal JE, Bankson NW, Flipsen P Jr. Articulation and phonological disorders. 8th ed. Boston: Allyn and Bacon; 1998. [Link]
- Rönnberg J, Rudner M, Lunner T, Zekveld AA. When cognition kicks in: Working memory and speech understanding in noise. Noise and Health. 2010; 12(49):263-9. [DOI:10.4103/1463-1741.70505] [PMID]
- McCreery RW, Walker EA, Spratford M, Lewis D, Brennan M. Auditory, cognitive, and linguistic factors predict speech recognition in adverse listening conditions for children with hearing loss. Frontiers in Neuroscience. 2019; 13:1093. [DOI:10.3389/fnins.2019.01093] [PMID] [PMCID]
- Jain C, Priya M, Joshi K. Relationship between temporal processing and phonological awareness in children with speech sound disorders. Clin Linguist Phon. 2020; 34(6):566-75. [DOI:10.1080/02699206.2019.1671902] [PMID]
- Windsor J, Kohnert K, Lobitz KF, Pham GT. Cross-language nonword repetition by bilingual and monolingual children. American Journal of Speech-Language Pathology. 2010; 19(4):298-310. [DOI:10.1044/1058-0360(2010/09-0064)] [PMID] [PMCID]
- Reeder RM, Cadieux J, Firszt JB. Quantification of speech-in-noise and sound localisation abilities in children with unilateral hearing loss and comparison to normal hearing peers. Audiology and Neurotology. 2015; 20(Suppl. 1):31-7.[DOI:10.1159/000380745] [PMID] [PMCID]
- Ruscetta MN, Arjmand EM, Pratt SR. Speech recognition abilities in noise for children with severe-to-profound unilateral hearing impairment. International Journal of Pediatric Otorhinolaryngology. 2005; 69(6):771-9. [DOI:10.1016/j.ijporl.2005.01.010] [PMID]
- Pupo AC, Esturaro GT, Barzaghi L, Trenche MC. Unilateral hearing loss in children: Phonology and vocabulary assessment. Audiology-Communication Research. 2016; 21:e1695. [DOI:10.1590/2317-6431-2016-1695]
- Fitzpatrick EM, Gaboury I, Durieux-Smith A, Coyle D, Whittingham J, Nassrallah F. Auditory and language outcomes in children with unilateral hearing loss. Hearing Research. 2019; 372:42-51. [DOI:10.1016/j.heares.2018.03.015] [PMID]
- Pittman AL, de Diego-Lázaro B. What can a child do with one normal-hearing ear? Speech perception and word learning in children with unilateral and bilateral hearing losses relative to peers with normal hearing. Ear and Hearing. 2021; 42(5):1228-37. [DOI:10.1097/AUD.0000000000001028] [PMID]
- Lewis D, Hoover B, Choi S, Stelmachowicz P. The relationship between speech perception in noise and phonological awareness skills for children with normal hearing. Ear and Hearing. 2010; 31(6):761. [DOI:10.1097/AUD.0b013e3181e5d188] [PMID] [PMCID]
- Neuman AC, Wroblewski M, Hajicek J, Rubinstein A. Combined effects of noise and reverberation on speech recognition performance of normal-hearing children and adults. Ear and Hearing. 2010; 31(3):336-44. [DOI:10.1097/AUD.0b013e3181d3d514] [PMID]
- Nelson PB, Soli S. Acoustical barriers to learning: Children at risk in every classroom. Language, Speech, and Hearing Services in Schools. 2000; 31(4):356-61. [DOI:10.1044/0161-1461.3104.356] [PMID]
Article type: Original Research Articles |
Subject:
Speech therapy
Received: 2026/03/24 | Accepted: 2026/07/28 | Published: 2026/09/26
Received: 2026/03/24 | Accepted: 2026/07/28 | Published: 2026/09/26
Send email to the article author

Copyright © The Author(s);
This is an open access article distributed under the terms of the Creative Commons Attribution-NonCommercial 4.0 (CC-By-NC 4.0), which permits use, distribution, and reproduction in any medium, provided the original work is properly cited and is not used for commercial purposes.
Contact Information
